


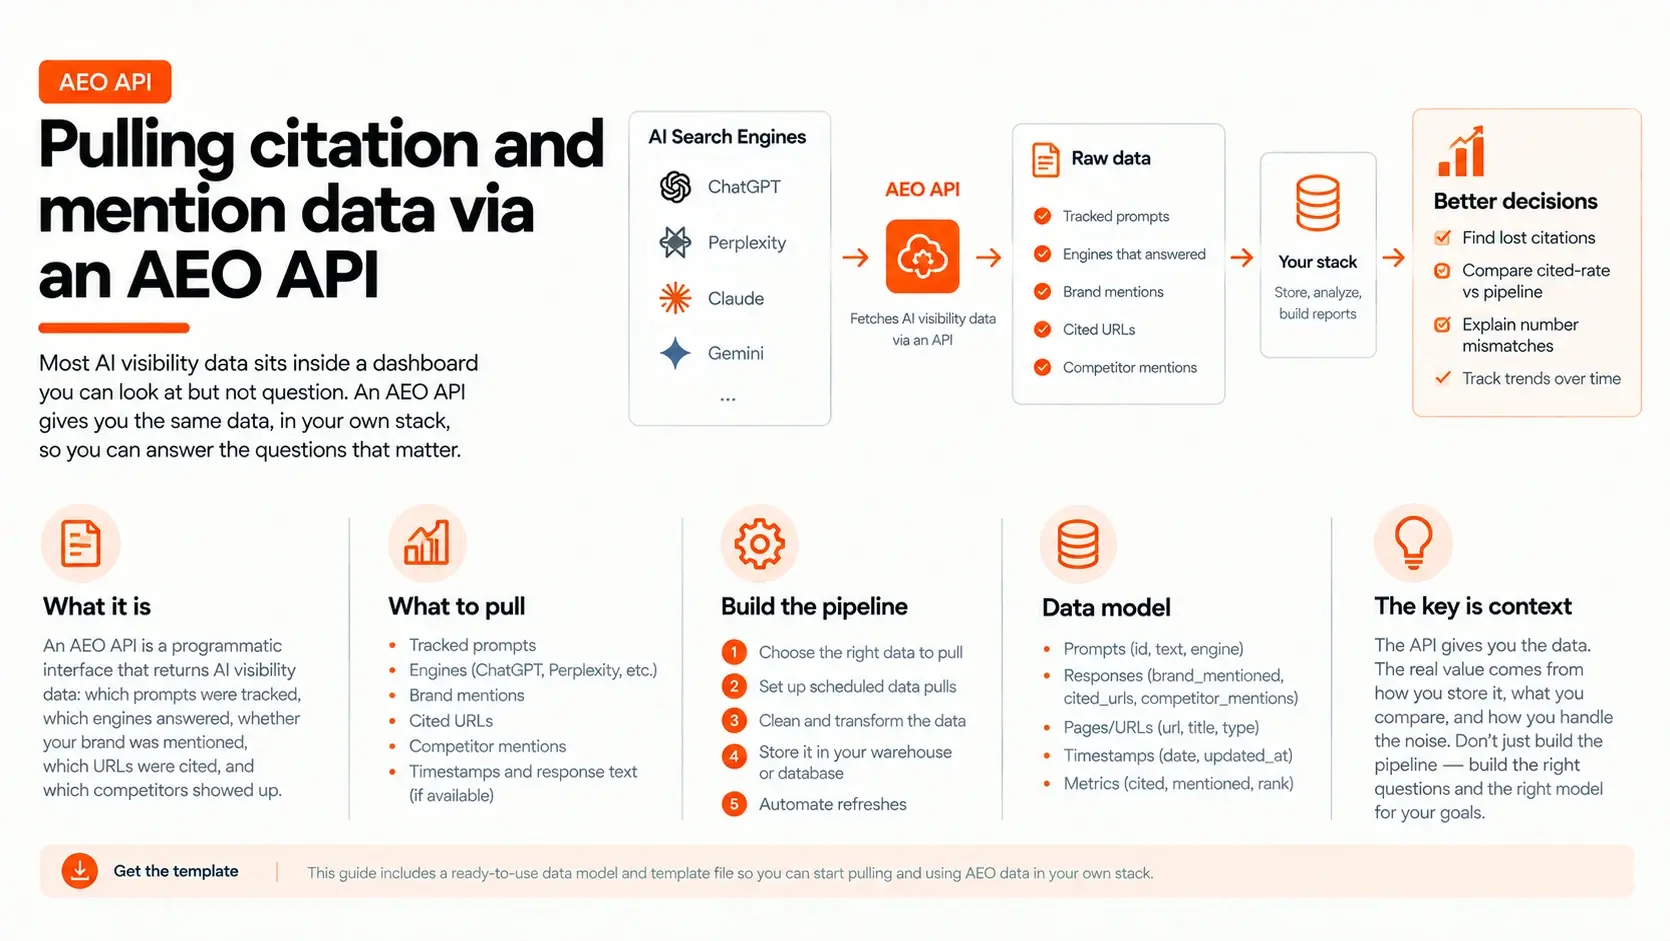


Most AI visibility data sits inside a dashboard you can look at but not question. That works until someone asks a question the dashboard was not built for: which of our pages lost a citation this month, how does cited-rate compare with pipeline by product line, or why does the number in the board deck not match the number in the weekly report. Those questions need the underlying data in your own stack, and that is what an AEO API is for.
An AEO API is any programmatic interface that returns AI visibility data: which prompts were tracked, which engines answered, whether your brand was mentioned, which URLs were cited, and which competitors showed up. Pulling it is the easy part. The harder part is deciding what to pull, how to store it, and how to read it without fooling yourself, because AI answers are noisy in ways that make a naive pipeline produce confident, wrong charts. This guide covers the data you can expect, the pipeline to build, a data model that holds up, and the template file at the end so you are not designing the schema from scratch.
What an AEO API actually returns
Mentions tell you whether your brand name appeared in the answer text. Citations tell you which source URLs the engine linked or listed, which is the part that can send a reader to your site. Those are different events, and a good API returns them as separate fields rather than one blended flag. If the distinction is new, our guide to citations versus mentions explains why the two behave differently by engine.
Competitor presence tells you which other brands were named in the same answer, which is what turns raw visibility into share of voice. The prompt itself and the engine that answered are the grouping keys for everything else. Many APIs also return the full answer text, which matters more than it sounds: with the text stored, you can re-run a new question against old data, such as how often a competitor was described as the cheaper option, without paying to collect it again. Some add position, sentiment, and an estimate of how much traffic a prompt carries. Treat those as useful extras and the first group as the foundation.
One caution applies to all of it. Ask where the data comes from before you trust it. Some providers query the model's developer interface, and some capture the answer a person sees in the consumer product. Those can differ, because the consumer product may search the web, apply a personal context, or format answers differently. Neither is wrong, but you should know which one your numbers describe, since it changes what the numbers mean for real buyers.
Decide what you are tracking before you pull anything
An API returns data for whatever prompts you gave it, so the prompt set is the real design decision. A scattered list of questions produces a scattered picture, and a list you keep editing produces trends that mean nothing.
Build the set from how your buyers actually ask: category questions, comparison questions, problem questions, and the branded questions people use late in a decision. Group the prompts by intent, since a citation on a research question and a citation on a vendor-comparison question do different jobs.
Our guides on mapping buyer prompts to your content and keyword and prompt clustering cover how to build and group the set. The rule for the pipeline is simple: version the prompt set, and when you must change it, add new prompts instead of rewriting old ones, so the history of each prompt stays comparable.
The pipeline from answer to chart
The path from an AI answer to a number you can chart has five stages, and the API is only the third.
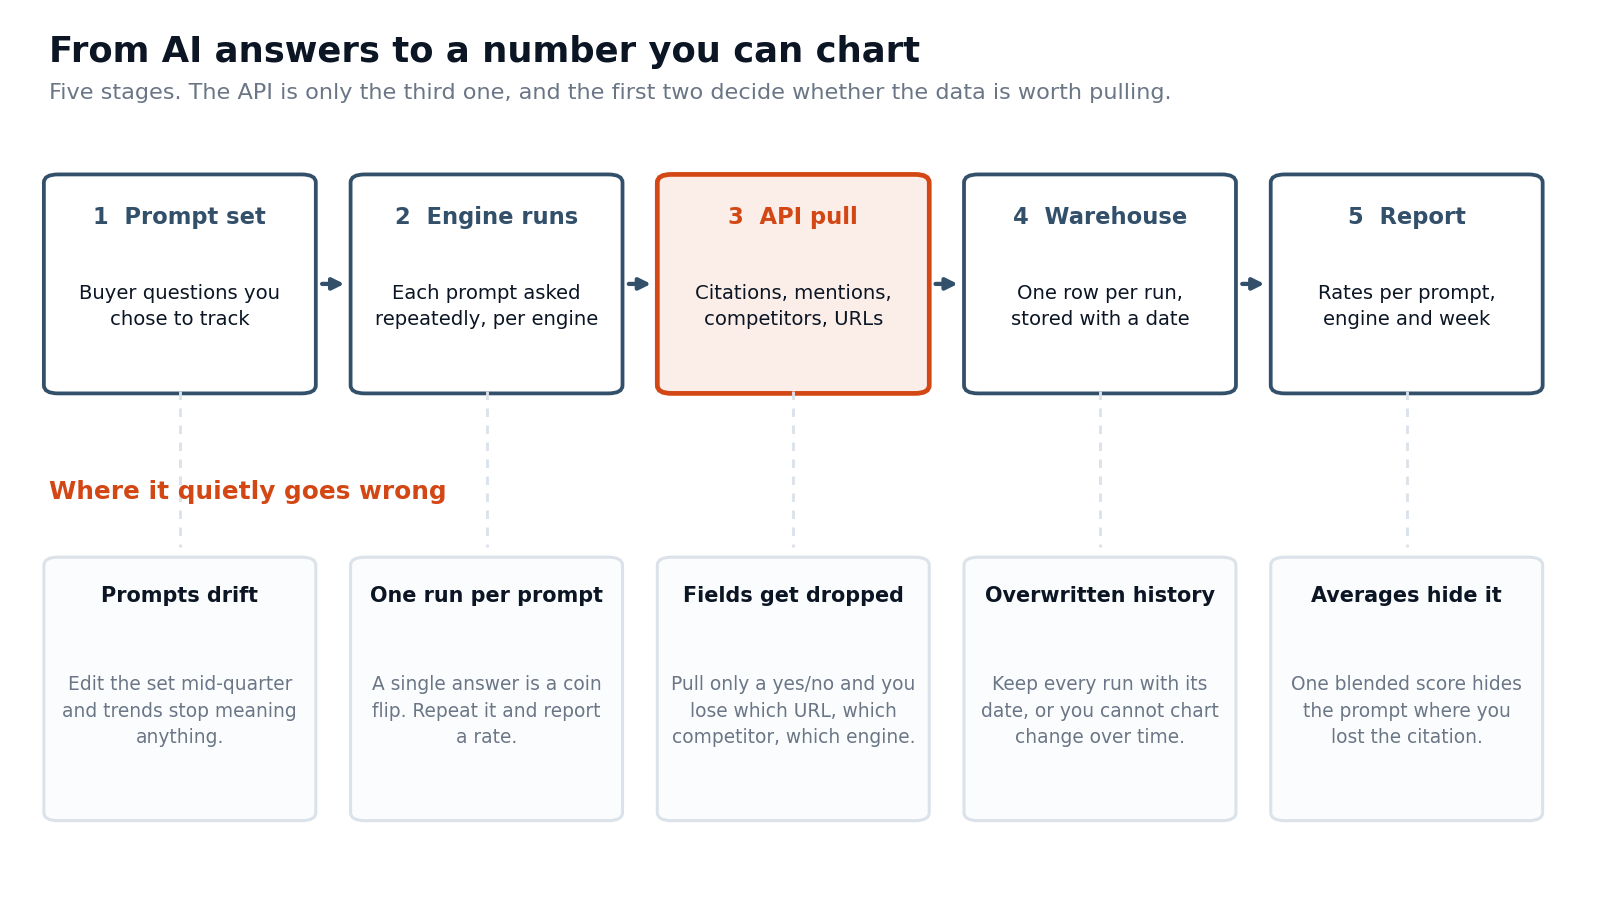
Your prompt set feeds repeated engine runs. The API returns the results of those runs. A job writes them into a warehouse or sheet, one row per run with a date. A report groups the rows into rates by prompt, engine, and week. Every stage has a quiet way to go wrong, shown under each box in the diagram, and none of them throw an error. A pipeline that drops the cited URL, overwrites yesterday's rows, or averages everything into one score will run cleanly for months and mislead the whole time.
Two of those failures deserve a rule each. First, keep every run, never just the latest value. History is the entire reason to have the data, and an overwrite is permanent. Second, keep the grain fine. Store one row per prompt, per engine, per run, and aggregate later, because you can always roll fine data up but you can never split a blended number back out.
The data model: one row per run
The design that holds up is one row per answer run, with the fields that let you ask any later question.
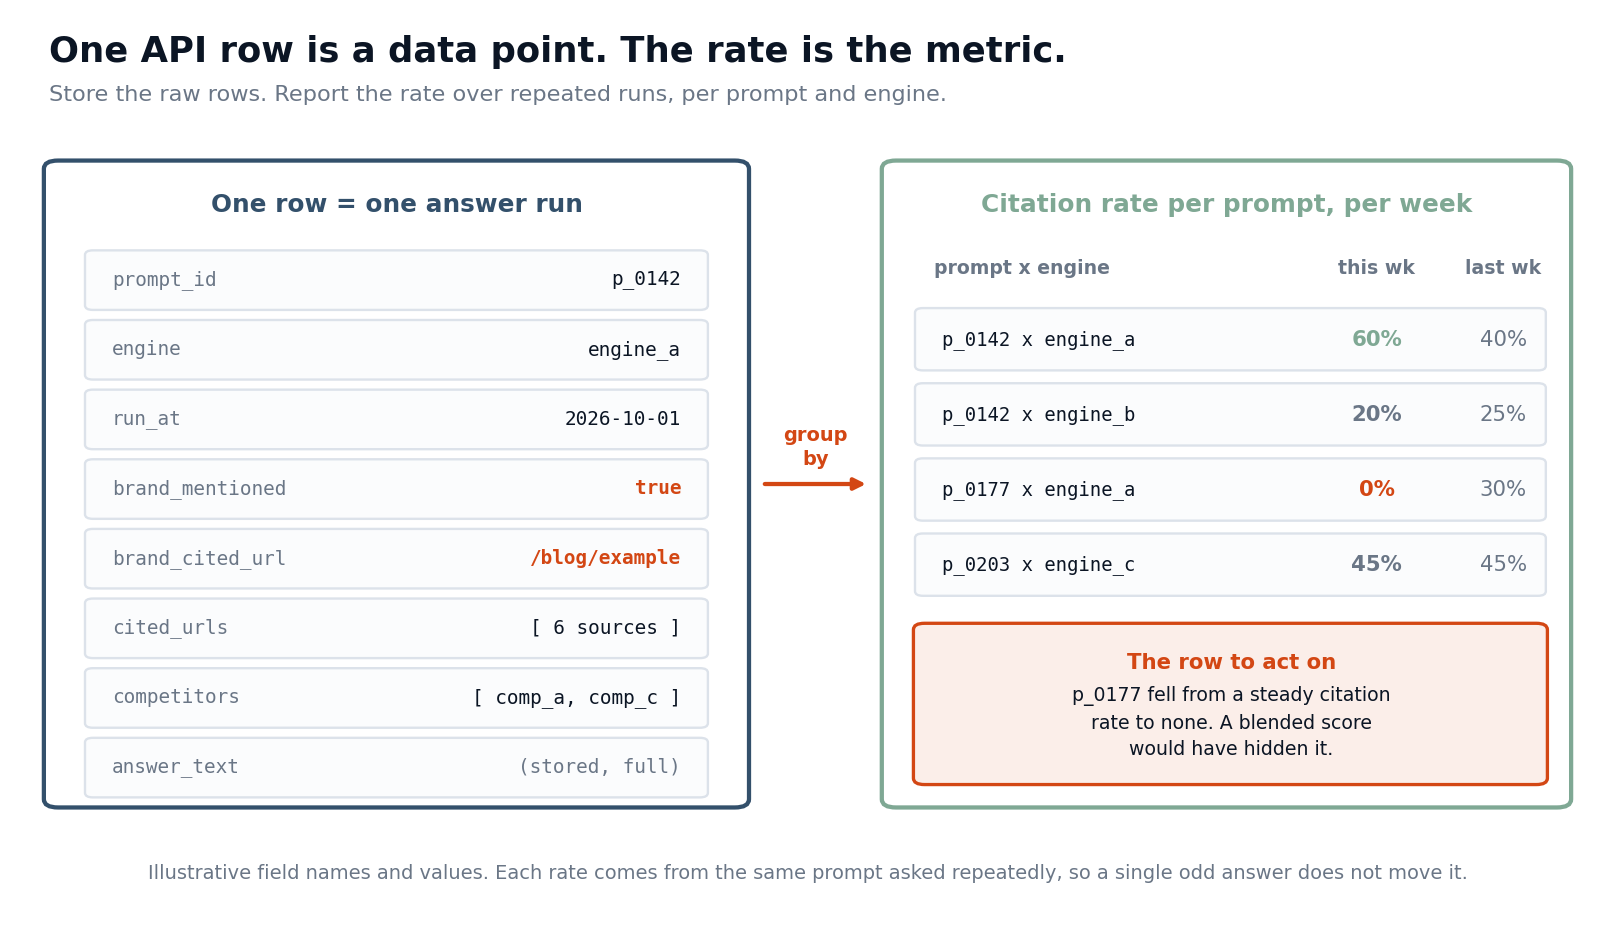
Each row carries the prompt, the engine, the timestamp, whether the brand was mentioned, which of your URLs was cited if any, the full list of cited sources, the competitors named, and the answer text. From those rows you derive everything else. The metric is not any single row. It is the rate: of the runs for this prompt on this engine this week, in how many were you cited. A single row is a data point. A rate over repeated runs is the number you report.
That distinction exists because AI answers are not deterministic. Ask the same question twice and the answer, the sources, and the brands named can change. Treating one run as the truth is the most common way these charts go wrong, and it is the reason AI search rankings fluctuate in the first place. If the API lets you set how many times a prompt runs, ask for repeats, and if it only returns one run per call, schedule the calls yourself.
The same logic tells you how much to trust a movement. Say you track one prompt on two engines with ten runs each per week. Engine A cites you in four of ten runs the first week and six of ten the second. That looks like a 20-point jump, and with ten runs it can easily be chance. Hold the conclusion until a few more weeks agree, or increase the runs. A rate on a small sample is a hint, not a result.
A minimal pull you can adapt
The mechanics of a pull are plain. Authenticate with a key, request the runs for a date range, page through the results, and write each row to storage with its date. This sketch uses a placeholder address and field names, so replace both with your provider's.
import requests, csv, datetime as dt
API = "https://api.example-vendor.com/v1/prompt-runs" # placeholder
KEY = "YOUR_API_KEY"
since = (dt.date.today() - dt.timedelta(days=7)).isoformat()
rows, page = [], 1
while True:
r = requests.get(API, headers={"Authorization": f"Bearer {KEY}"},
params={"since": since, "page": page, "page_size": 100})
r.raise_for_status()
data = r.json()
rows += data["results"]
if not data.get("next_page"):
break
page = data["next_page"]
with open("runs.csv", "a", newline="") as f:
w = csv.writer(f)
for x in rows:
w.writerow([x["prompt_id"], x["engine"], x["run_at"],
x["brand_mentioned"], x["brand_cited_url"],
len(x["cited_urls"]), "|".join(x["competitors"])])
Two habits matter more than the code. Append rather than overwrite, so each pull adds to the history. And store the raw response alongside the flattened row, so if you later decide you need a field you skipped, you can rebuild without re-collecting. The template file at the end includes the full record, a table definition, and the query that turns the rows into weekly rates.
Reading the data without fooling yourself
Compare like with like. A rate on engine A and a rate on engine B are different measurements, because engines cite differently and answer different mixes of questions, so report them side by side instead of averaging them. Our look at citation overlap across engines shows why a strong result on one engine says little about another.
Keep mentions and citations apart in every chart. A brand can be named often and linked rarely, and the gap is information. A rising mention rate with a flat citation rate means engines know you but are not sourcing from you, which points to a different fix than a falling mention rate does.
Look at the prompt level before the rollup. A blended score can hold steady while one important prompt drops to zero, as in the diagram above, and the rollup will not tell you. Sort by the change per prompt and read the biggest movers first.
Finally, put the AI data beside your own. The point of having it in your stack is to join it with web analytics and CRM data, so that a citation gain on a prompt can be checked against visits, demo requests, and pipeline for the page that earned it. Treat the link as a hypothesis to test and not proof, since a citation does not guarantee a click and many readers never click. The wider picture of what to track and why is in our guide to AI search visibility metrics, and the case for measuring on live engines is in why live model checks matter.
Build your own collection, or use a provider's data?
There are two ways to get this data, and they are not interchangeable. You can build collection yourself, by sending your prompts to engines through their developer interfaces or a web data service and parsing the answers. Or you can use a platform that already runs the prompts and exposes the results through its API.
Building gives you full control over prompts, run counts, and parsing, and it suits teams with engineering time and unusual needs. The cost is real: you own the parsing of every engine's output format, the handling of changes when an engine updates, the scheduling, and the cleanup of mentions and competitor names, which is fiddly work. Using a platform's API moves that burden to the provider and gets you to the analysis faster, at the price of depending on how that provider collects and defines things.
Most marketing and analytics teams do better buying the collection and building the analysis, since the analysis is where their own data and judgment add value. Build collection yourself only if the control is worth the maintenance.
Questions to ask before you rely on an API
Before you wire any provider into reporting, get answers to a handful of questions, because the answers decide whether the numbers are comparable over time.
Which engines and which surface does it cover, the developer interface or the consumer product? How many times is each prompt run per period, and can you change it? Do you get the full answer text and the full list of cited URLs, or only a yes or no? Are mentions and citations separate fields? How are competitors detected and named? Is history retained and exportable, and for how long? What are the rate limits and the pagination rules? And what happens to your historical series if the provider changes how it collects, which is a question about versioning that most teams forget to ask until a chart breaks. A provider that answers these plainly is one whose data you can build on.
Five pulls worth scheduling
Once the pipeline runs, a small set of recurring queries earns its keep. A weekly rate per prompt and engine, which is the core view. A list of prompts where your citation rate fell, sorted by the size of the drop, so you act on the loss first. A list of prompts where a competitor is cited and you are not, which is a content gap with a named target. The pages that earned citations this month, joined to their traffic and conversions. And a changes report showing sources that appeared or disappeared for your top prompts, which flags third-party pages that started or stopped carrying your story. Each of these answers a decision, and none of them needs more than the one-row-per-run table.
Frequently asked questions
What is an AEO API?
A programmatic interface that returns AI visibility data, such as the prompts tracked, the engines that answered, whether your brand was mentioned, which URLs were cited, and which competitors appeared.
Why do I need the data outside a dashboard?
To join it with your own analytics and CRM, answer questions the dashboard was not built for, keep your own history, and report consistently across tools.
Should I pull one run per prompt?
No. AI answers vary between runs, so pull repeated runs and report a rate. One run is a data point, not a result.
Can I build this without writing code?
Often yes. Many providers offer exports or connectors to spreadsheets and BI tools, which cover simple reporting. An API pays off when you want to join the data to other systems or keep a long history in a warehouse.
How often should I pull it?
Match the cadence to how fast you act on it. Weekly rates suit most B2B teams. Pull daily only if you run the volume to make a daily rate meaningful.
Start with one prompt group
You do not need the whole pipeline on day one. Pick one group of buyer prompts, fix the list, and store every run as a row with a date. Add the weekly rate query from the template file, and let it collect for a few weeks before you draw conclusions. That small, clean series teaches you more than a large, messy one.
If you want to see where your pages stand today before building anything, try our AI Search Visibility Checker. And if you would rather not build the collection layer, Omnibound's AI Search Intelligence tracks your prompts across engines and shows which of your pages are cited, so your time goes into the analysis instead of the plumbing.