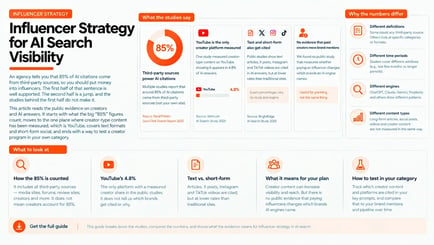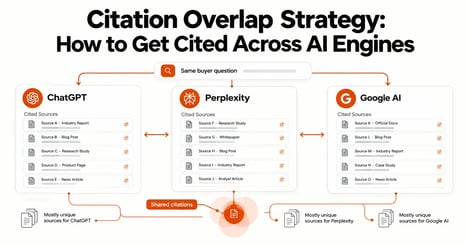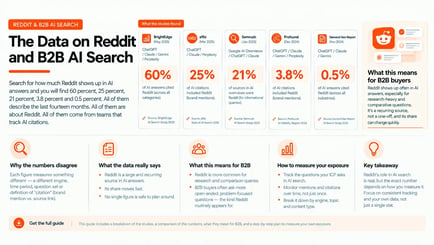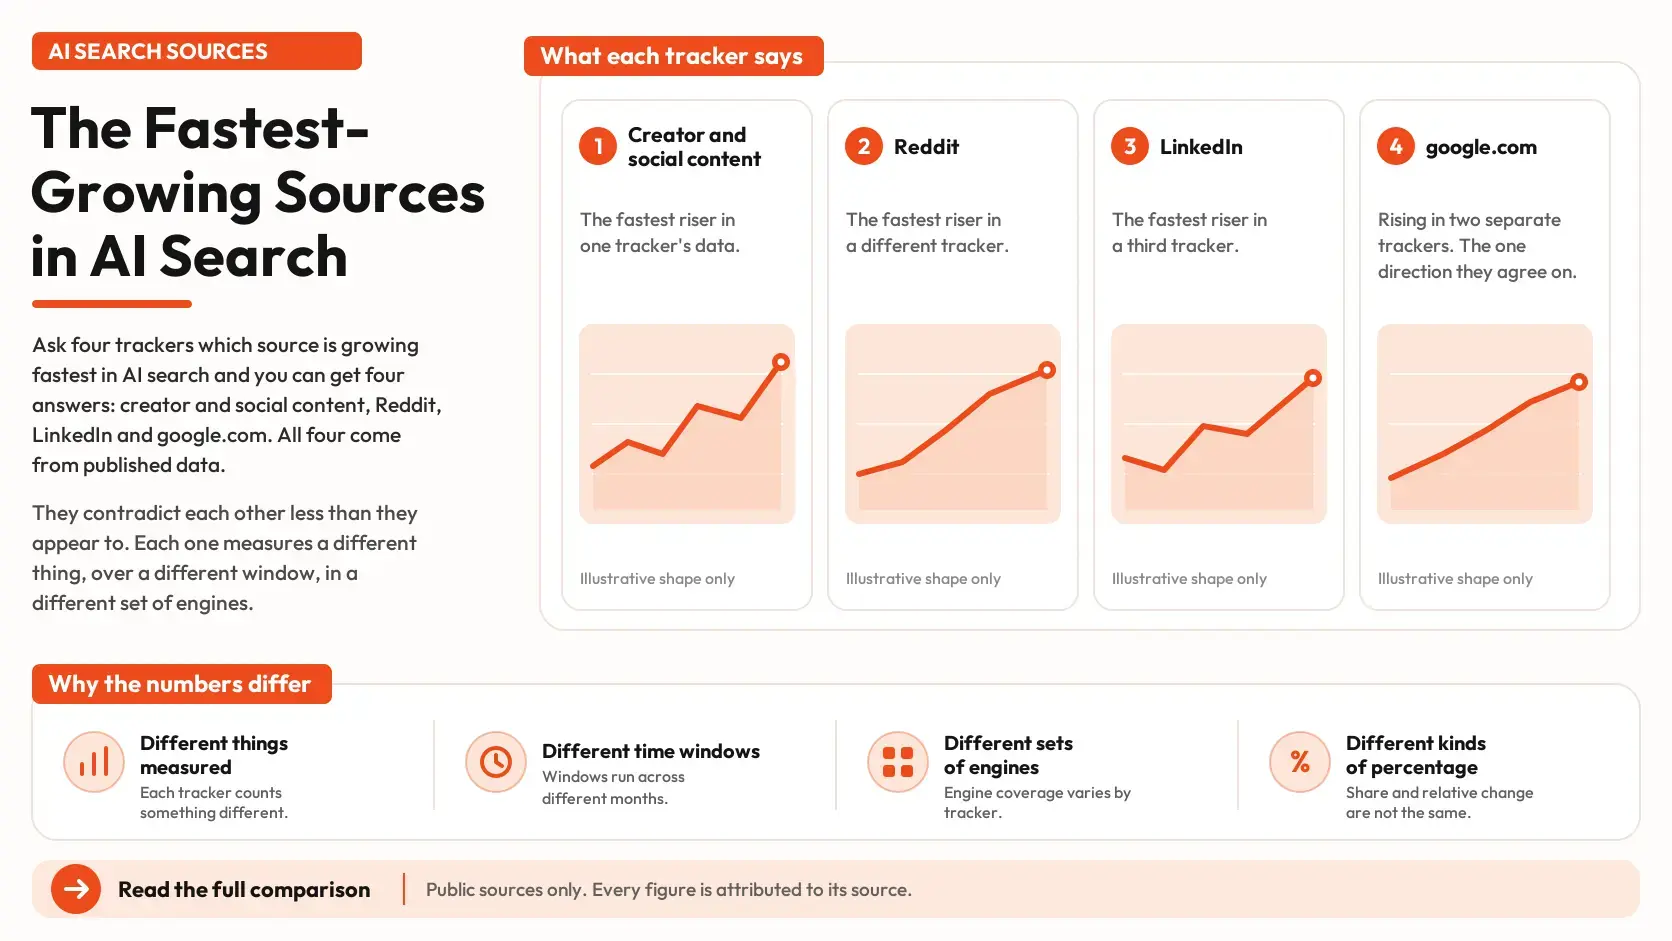


Ask four trackers which source is growing fastest in AI search and you can get four answers: creator and social content, Reddit, LinkedIn, and google.com. All four come from published data. They contradict each other less than they appear to, because each one measures a different thing, over a different window, in a different set of engines.
This article reads those growth claims side by side. It starts with what each tracker reported, shows why the numbers cannot be lined up directly, goes through the sources that keep appearing in the headlines (YouTube, Reddit, LinkedIn and Google itself), and ends with what a B2B team can do with numbers that move this much. It uses public sources only. It contains no Omnibound data, every figure is attributed to its source, and where we do arithmetic or infer something, we say so.
Here is the reading in one paragraph. Several sources grew in at least one tracker during 2026, including YouTube, creator content, LinkedIn, Wikipedia and google.com, and no source we checked grew in every tracker and every window. The one direction that two separate trackers agree on is Google citing its own domains more often. Everything else depends on which month, which engine and which kind of percentage you pick.
Four trackers, four answers
The claims below are the ones most likely to be repeated in a deck. Each row is a different measure, so the rows are not a ranking.
| Tracker | What it says grew | Measure and window | What it counts |
|---|---|---|---|
| AirOps (August 2026) | Creator and social content: YouTube, LinkedIn, Instagram, TikTok, Facebook, X. Reddit and Quora are excluded | Share of citations up 140 percent over 11 months, August 2025 to June 2026 | About 3.5 billion citations tracked monthly. AirOps says no other category more than doubled |
| Tinuiti, using Profound data | Share of citations up at least 73 percent, October 2025 to January 2026 | Seven engines, averaged with equal weight, across nine categories with static commercial-intent prompts | |
| Meltwater (August 2026) | Citation volume up 67.8 percent in July versus June 2026 | Eight engines; volume of citations to a domain, with no share given for individual domains | |
| Promptwatch | google.com | Share of Google AI Mode citations from 4.24 to 7.31 percent, May to June 2026 | One engine, its own citation sample |
Each tracker is a vendor with its own prompt set, and each is describing real data from its own panel. None of them is wrong about its own numbers. The trouble starts when a number from one row is quoted as if it answered the question in another.
Five things a growth number hides
Percent or points. A share that moves from 2 percent to 4 percent has grown by 100 percent and by two percentage points. Both statements are true, and only one of them tells you how much of the answer changed. Many trackers report the first, some report the second, and a few do not say which.
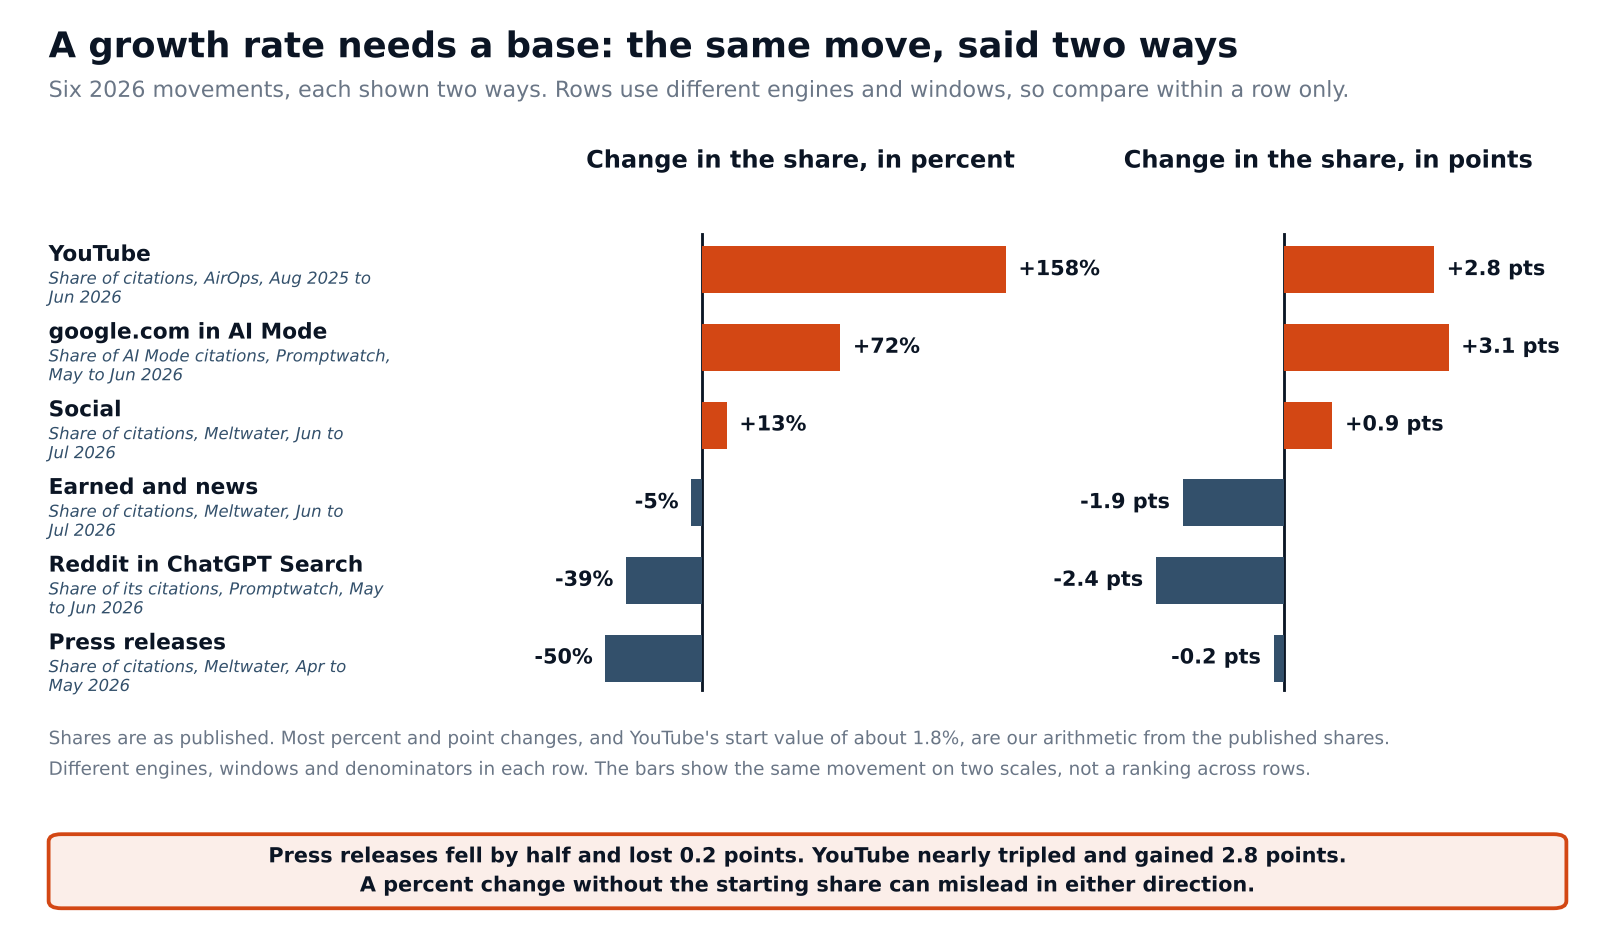
The chart shows six movements reported in 2026 trackers, each on both scales. AirOps reports that YouTube's share of all citations rose 158 percent, nearly tripling, to 4.6 percent. Working back from those two numbers, the starting share was about 1.8 percent, so the gain was about 2.8 points. Meltwater reports press releases falling from 0.4 percent to 0.2 percent of citations between April and May, which is a drop of about half and a loss of 0.2 points. In share terms, google.com's gain in AI Mode over one month in Promptwatch's data, about 3 points, was larger than YouTube's gain over eleven months in AirOps' data.
The base. A small starting share doubles easily. A source that holds 0.4 percent of citations and moves to 0.8 has doubled, and an engine that changes how it counts or displays sources could produce that without any change in the web. This is why "up 450 percent" and "nearly tripled" tell you little until you see the starting number.
The window. Eleven months, three months and one month give different answers for the same source, and a window that begins at a seasonal low or ends at a peak flatters the trend. Reddit is the clearest example, covered below.
The engine. Citation habits differ by engine, so an average across engines can hide where a source is growing. AirOps reports that about one in 9.5 citations in Google AI Overviews comes from creator surfaces, and that creator sources are 0.9 percent of ChatGPT's citations. Tinuiti averages seven engines with equal weight, so a small engine moves the average as much as a large one. A related trap: in AirOps' data YouTube is 0.1 percent of ChatGPT's citations, while in the OtterlyAI study we covered in our influencer piece, ChatGPT supplied 4.4 percent of YouTube's citations. One is YouTube's share of ChatGPT's citations, the other is ChatGPT's share of YouTube's. They answer different questions.
Volume or share. A source can gain citations because the sample grew, because the engines cited more sources per answer, or because the source itself gained ground. Volume alone cannot separate those. Share is a better signal, but only if the denominator is stated.
YouTube: up, down and flat
YouTube shows how much the answer depends on where you look. In AirOps' 11-month window its share nearly tripled. In Meltwater's volume data it was up 56.4 percent in May versus April and up 24.3 percent in July versus June. In Promptwatch's May to June comparison it rose from 3.74 to 4.16 percent of Google AI Overviews citations and fell from 3.42 to 2.88 percent of AI Mode citations in the same month.
Tinuiti found that YouTube gained on Reddit in November 2025 and lost the gain in December, with no sustained growth across its October to January window. In the Ahrefs list for AI Mode that we covered in our reading of the most-cited domains in Google AI Mode, YouTube went from 21.1 percent in the July 21 reading to 17.8 percent in the September 2 reading.
Those are not necessarily in conflict. A source can rise over a year, wobble from month to month and move in opposite directions in two Google products. What they do rule out is a plain statement that YouTube is growing in AI search without saying where, over what period, and in what measure.
One month, two stories: Meltwater's domain tables
Meltwater publishes a monthly table with the change in citations for each of its top domains. Two of its reports, May and July, list the same nine domains, which makes it possible to see whether a month's winner stays a winner.
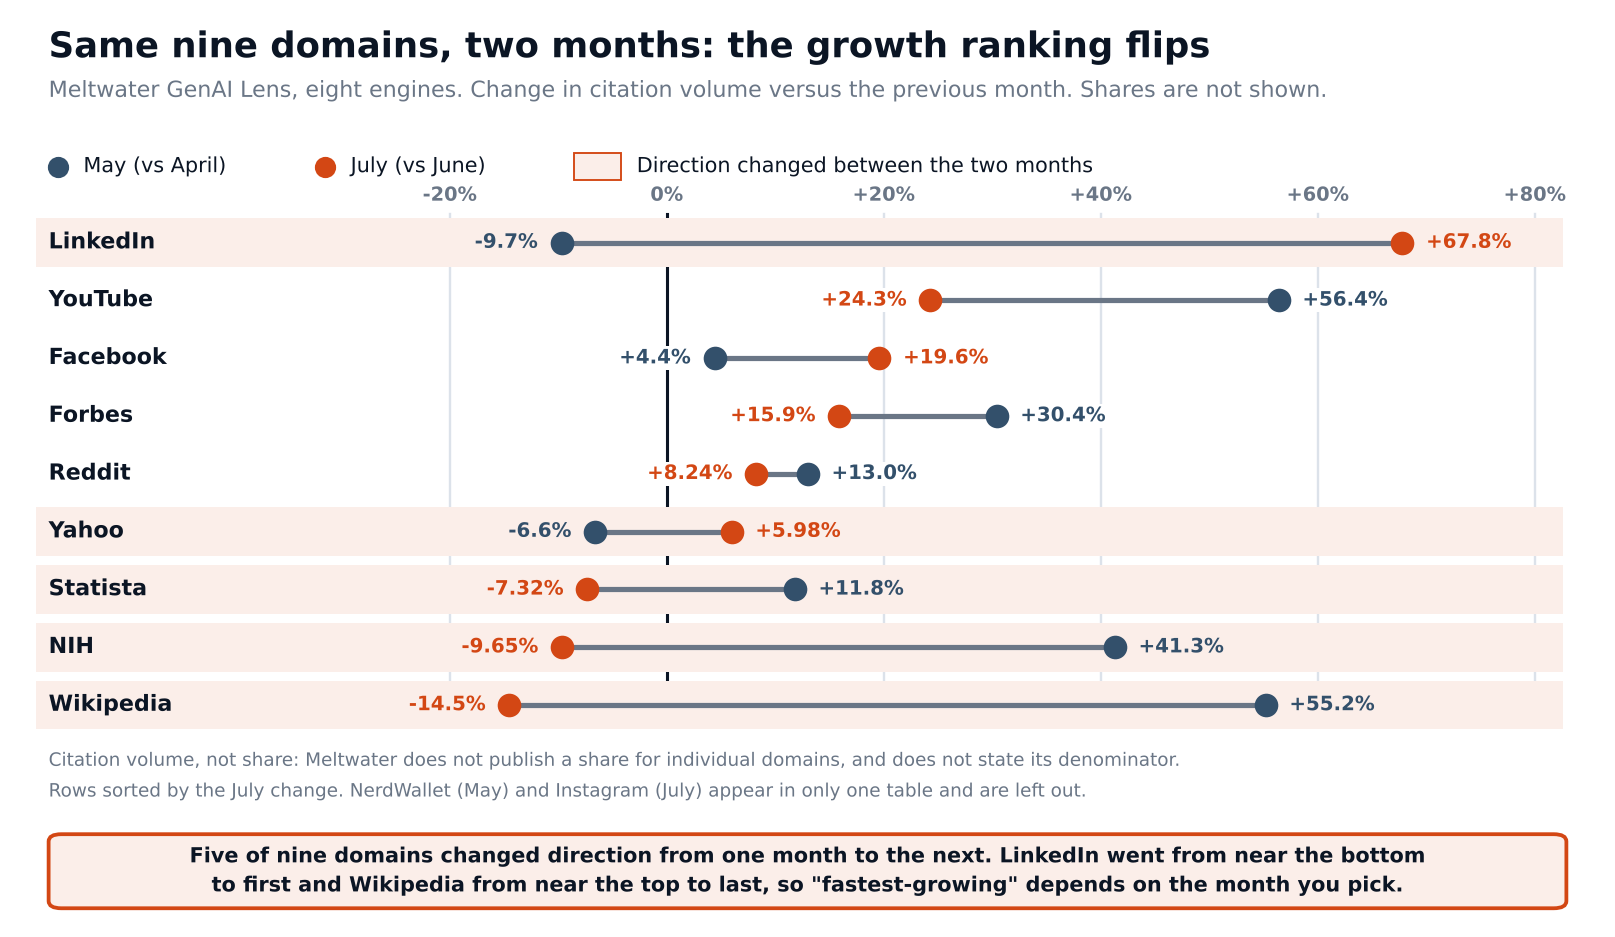
It mostly does not. Five of the nine domains changed direction between the two months. LinkedIn fell 9.7 percent in May and rose 67.8 percent in July. Wikipedia rose 55.2 percent in May and fell 14.5 percent in July. NIH went from up 41.3 percent to down 9.65, Statista from up 11.8 to down 7.32, and Yahoo from down 6.6 to up 5.98. YouTube, Reddit, Forbes and Facebook stayed positive both months, though by different amounts.
Two cautions about the data. These are changes in citation volume, not in share, and Meltwater does not state the denominator for its domain table. We also found no June domain comparison in the pages we read, so the chart sets May against July, which are not consecutive months. And the source-type table in the July report does not quite reconcile with the counts beside it: the counts put the "Other" category at about 56.0 percent of the total, against a stated 56.4. A decimal in these tables is a rough guide, not a measurement.
The LinkedIn jump is the figure most likely to circulate, and it is a single month. Our reading of LinkedIn citation data found that studies disagree on LinkedIn's rank and on which direction it is moving. AirOps puts LinkedIn inside its creator and social category, where it reports that published written content is 89 percent of LinkedIn's citations, with personal profiles and company pages together at 7 percent.
Reddit: up through January, lower since in some engines
Tinuiti's report, built on Profound data, found that Reddit's share of citations grew by at least 73 percent from October 2025 to January 2026 across the engines and categories it studied, and nearly doubled overall in that window. That is the figure behind many "Reddit is the fastest-growing source" claims.
The window matters. AirOps, which excludes Reddit from its creator and social category, reports that Reddit's share peaked near 5.3 percent of all citations around the holidays, then levelled at 3.3 percent. Promptwatch's data splits by engine: Reddit's share of ChatGPT Search citations fell from 6.11 percent in May to 3.71 percent in June (June 1 to 27), while in the same two months it rose from 2.36 to 2.52 percent in AI Mode and from 2.52 to 2.72 percent in AI Overviews. In Meltwater's volume data Reddit was up 13.0 percent in May and 8.24 percent in July.
A window that starts in October and ends in January catches a rise. A window that starts at the holiday peak catches a fall. Both are real. Our readings of Reddit's share of B2B AI answers go through the swings in more detail.
The source two trackers agree on: Google itself
One movement appears in more than one place. In Promptwatch's data, google.com's share of AI Mode citations rose from 4.24 percent in May to 7.31 percent in June, and its share of AI Overviews citations rose from 1.15 to 2.30 percent over the same two months. Promptwatch also reports that google.com in AI Overviews was 0.37 percent in January and 2.30 percent in June, about six times as large. Separately, in the Ahrefs list we covered in the AI Mode piece, Google sat at 7.1 percent in the July 21 reading and 12.5 percent in the September 2 reading.
Those are different trackers, different metrics and different months, and they point the same way. None of the pages we read explains why, so we will not offer a cause. For a B2B team, the practical point is that a rising share held by one engine's own parent is a share that is not going to creators, forums or your own site.
What is shrinking
Growth claims come with a mirror image, and the shrinking side is just as exposed to the base problem.
Press releases are the clearest case in Meltwater's data: 0.4 percent of citations in April, 0.2 percent in May, and 0.2 percent again in June and July. Meltwater reads the drop as engines preferring third-party validation over self-published messaging. Our inference is more cautious: at one decimal place, a rounding step alone can show a 50 percent change on a share this small.
AirOps reports that the citation share of owned brand and product pages fell 10 percent between August 2025 and June 2026, without saying whether the figure is relative or in points. Meltwater's earned and news category fell from 39.5 to 37.6 percent between April and May and from 35.0 to 33.1 percent between June and July, about 1.9 points each time, though the two comparisons are separate windows and not one continuous series. Earned media is also a wide bucket. As we covered in the influencer piece, Muck Rack's "earned media" at about 84 percent includes journalism, academic and government sources and third-party corporate content, which is why its figure and Meltwater's cannot be compared directly. See that reading of the 85 percent figures.
The biggest mover has no name
In Meltwater's source-type tables the category that gained the most is "Other." It rose from 50.3 to 53.7 percent between April and May, a gain of 3.4 points, and from 55.2 to 56.4 percent between June and July, which the July report calls a third month of growth. The May report calls the trend inconclusive.
Neither page defines "Other" beyond being outside the named categories. Our inference: a rising catch-all share could mean citations are spreading across more sites that no tracker names, and not moving toward any one source. A separate finding in Tinuiti's data points the same way, with some caution: Google AI Mode cited 57 percent more unique domains than AI Overviews in November 2025 and 143 percent more in January 2026, though Tinuiti notes that a 46 percent drop in tracked AI Overviews citations may reflect tracking changes. We would treat both as hints, not conclusions.
Whose panel is this?
Most growth data comes from panels that are not B2B. Tinuiti's nine categories are mostly product categories, with static commercial-intent prompts. AirOps' industry cuts cover about 80 high-citation brands across six industries it assigned manually, on samples it does not size. Meltwater and Promptwatch use general prompt sets. A source that is rising in those panels may or may not be rising for the questions a procurement lead or an IT buyer types.
The B2B-specific readings we have are narrower and older. In the AI Mode piece we covered a B2B panel from Analyze, where the top 10 domains held 13.1 percent of citations and the top 50 held 34.0 percent, a more spread-out picture than the headline domains suggest. And our reading of first-party versus third-party sources covers how much of the answer comes from pages other than the brand's own. Neither tells you what is growing this quarter. They tell you that a B2B answer draws on many sources, which is one more reason to track your own category and not another panel's.
How a B2B team can use numbers that move this much
Treat a growth headline as a prompt to look at your own data, not as a reason to change a plan.
Track categories before domains. Group the sources cited for your buyers' questions into a handful of types: review sites, forums and communities, video, professional social, news and trade press, and your own pages. A category is more stable than any single domain, and a move in a category is more worth acting on.
Run the same prompts every month, per engine, and record the share and the denominator. Report each change as a share in points as well as a percent, and name the engine. A fixed prompt set of 15 to 30 questions, run several times per prompt, is enough to see a category move. Do not mix engines in one number.
Act on a move that holds. A rule we suggest, not one taken from a study: wait for the same direction in the same engine for three consecutive months before changing where you put effort. A single month in Meltwater's data would have sent a team in opposite directions for LinkedIn and Wikipedia.
When a source does rise for your prompts, check your presence there before you spend anything. If video is rising for the questions your buyers ask, look at whether you have a long-form video on those three questions, as in our influencer piece. If a forum is rising, look at whether it is readable to engines and whether anyone from your team answers there plainly and under their own name. If news is falling, it is not a reason to stop earning coverage.
If you want help building a steady third-party presence across the sources that keep showing up for your category, AI authority building is the service we offer for it. The broader signals framework is in our offsite signals hub.
Check a growth claim before you repeat it
Four questions cover most of the problems above. Is the change in percent or in points, and what was the starting share? Which engine is it, and is it one your buyers use? What is the window, and does a different start or end date change the story? Is it a share or a volume, and does the page state the denominator? A claim that cannot answer all four is a headline, not a finding.
Questions people ask
What is the fastest-growing source in AI search?
It depends on the tracker, the window and the engine. AirOps reports creator and social content growing fastest over 11 months, Tinuiti found Reddit growing from October to January, Meltwater found LinkedIn jumping in July, and Promptwatch found google.com growing in Google's own engines.
Is Reddit still growing in AI answers?
It grew from October 2025 to January 2026 in Tinuiti's data. Since then the picture depends on the engine: Promptwatch shows ChatGPT Search lower and Google's engines slightly higher in May to June.
Is YouTube growing in AI search?
Over 11 months, AirOps reports that its share nearly tripled. Month to month it moved in different directions across engines in other trackers.
Why do reports disagree about which sources are growing?
They differ in the metric (percent or points), the window, the engines, the denominator and whether they count volume or share.
How should a B2B team track growth in AI sources?
Fix 15 to 30 prompts for your category, run them monthly per engine, record share in points and percent, and wait for a move to hold across several months before acting.
Track the shares, not the headlines
A growth headline makes a source sound like a trend. The share tells you how much of an answer it holds and in which engine, and that is what decides whether a rising source matters to your buyers. The trackers above are useful as a list of places to look. Your own prompts decide whether any of them is rising where you need it to.
To start with a baseline, the AI Search Visibility Checker shows how engines describe your company today and which pages they draw on. AI Search Intelligence tracks which sources are cited for your category prompts month by month and engine by engine, so you can see whether a riser is rising for your buyers or only in someone else's panel.