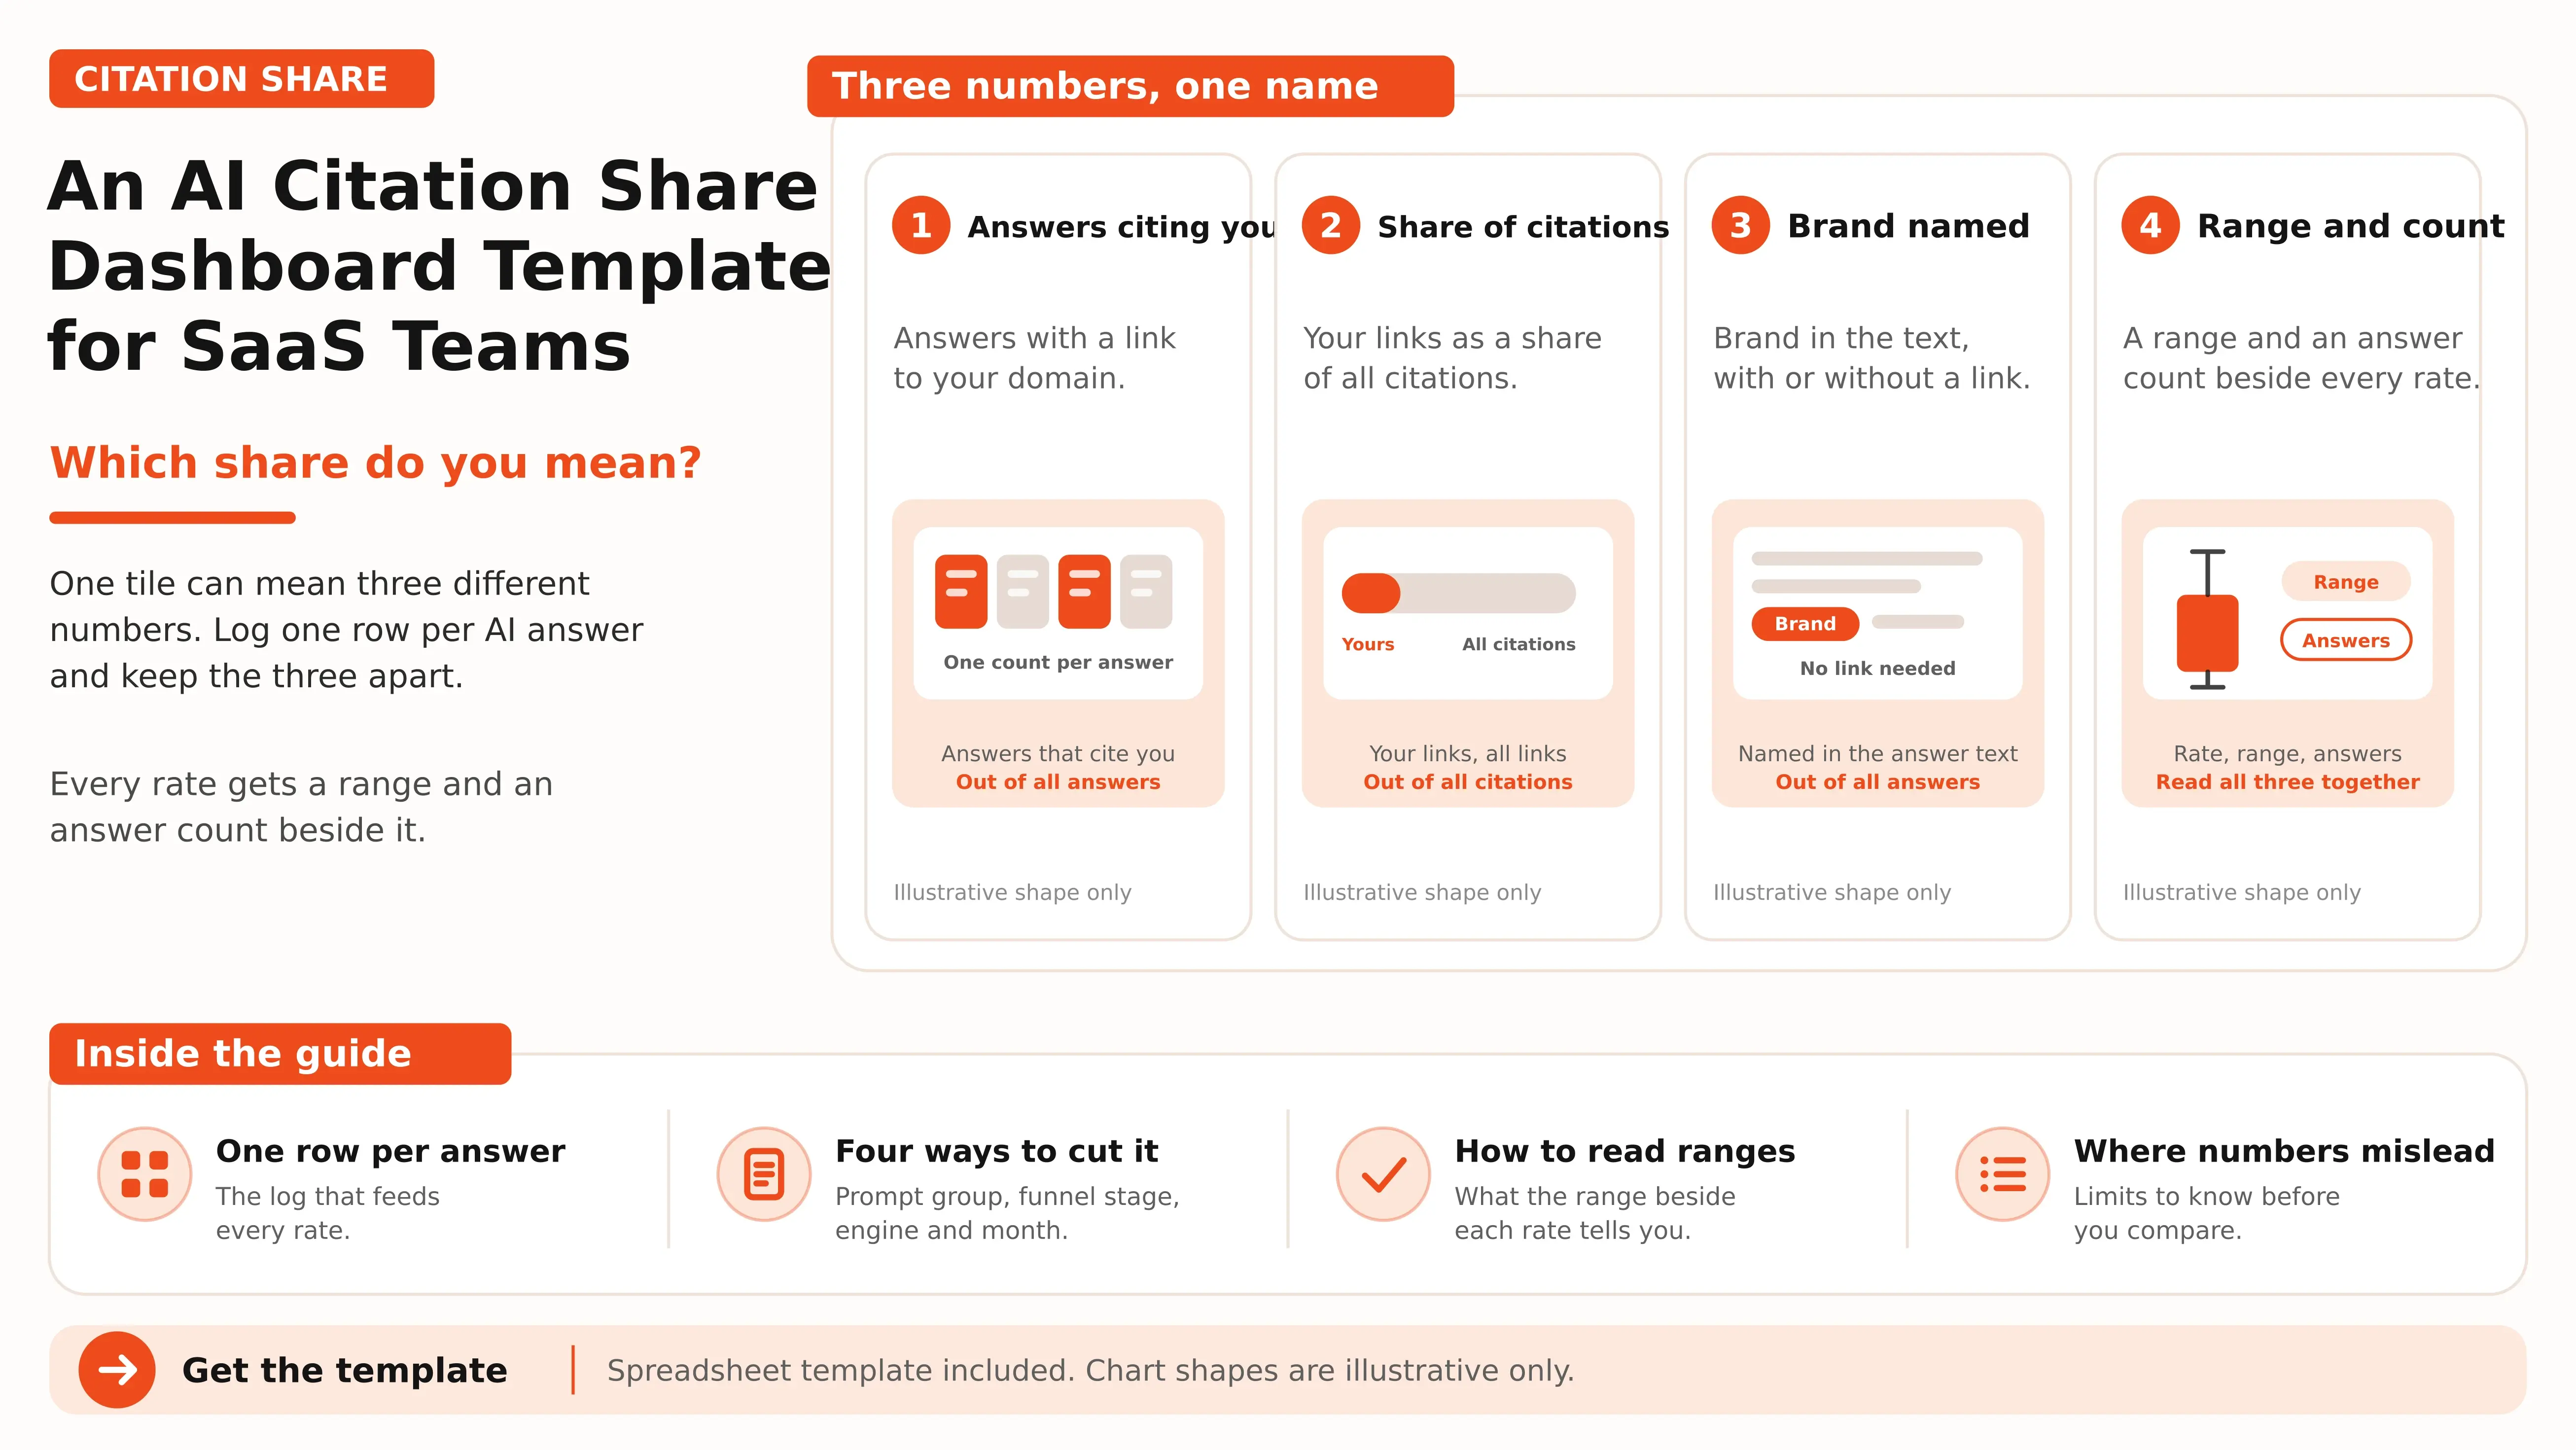


Your dashboard says AI citation share is 14%. But 14% of what? AI answers that cite your domain? Total citations that belong to your brand. or answers that mention your brand at all?
These are three different metrics. Confuse them, and your competitor comparisons, monthly reports, and growth decisions start telling the wrong story. This post gives you a spreadsheet template to track all three separately. Log one row per AI answer, and get rates by prompt group, funnel stage, AI engine, and month, with sample sizes and ranges to put each number in context. You’ll also learn how to read the dashboard, interpret the ranges, and spot where the numbers can mislead you.
Three numbers that all get called citation share
Take four invented answers to the same prompt. Answer 1 has four citations and one of them points to your domain. Answer 2 has five citations and none are yours. Answer 3 has three citations and two are yours. Answer 4 has six citations, none are yours, but its text names your brand.
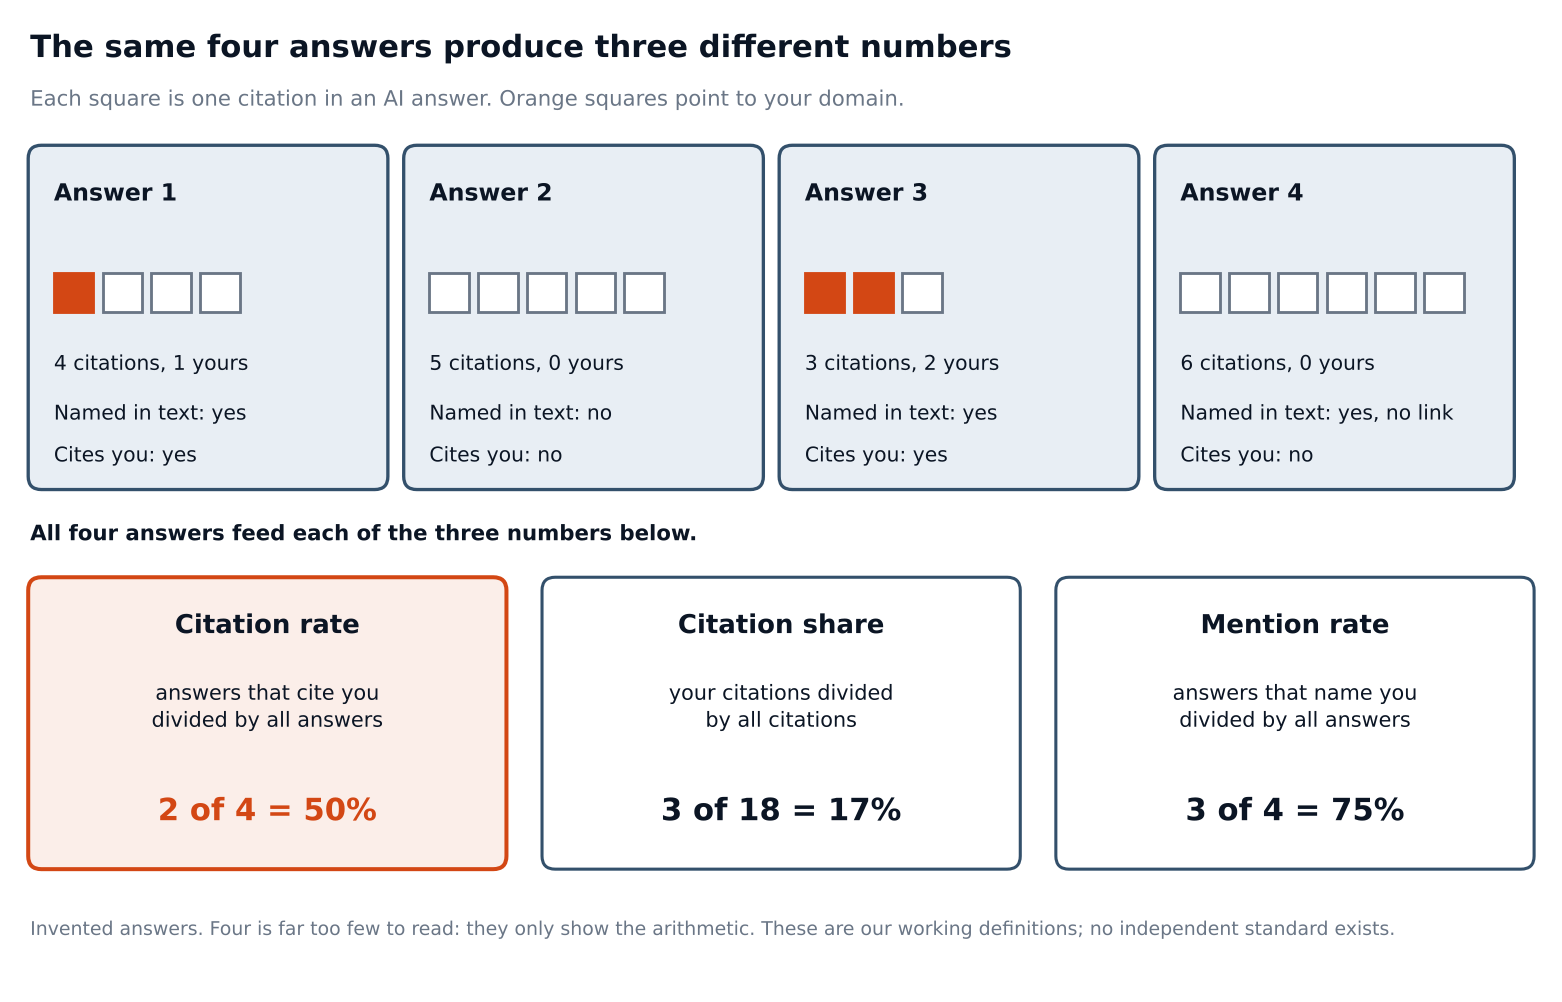
Figure 1. The same four invented answers produce a citation rate of 50 percent, a citation share of 17 percent and a mention rate of 75 percent.
Citation rate counts answers: how many cited you at least once, out of all answers. Citation share counts citations: how many of the citations in those answers were yours. Named-in-text rate counts answers that name your brand, with or without a link. A brand can be named without being cited and cited without being named, a difference covered in citations vs mentions in ChatGPT.
These are working definitions. We did not find an independent standard for citation share, so each team has to choose a definition and print it under the number. The template calculates all three and labels each one.
The three move independently. Because one answer can carry several citations, your share can double when you are cited twice in answers that already cited you, with no change in rate. Rate can rise while share falls, if more answers cite you but the answers have grown longer source lists. That is why a single tile called "citation share" is not enough.
The five panels, and what each one is for
Figure 2. A wireframe of the dashboard with invented numbers. Every rate carries a range and an answer count.
Panel A splits the results by prompt group. Branded prompts, which name your company, are likely to produce higher rates than prompts that do not, because the engine is already being asked about you. Blend them and the headline mostly measures how many branded prompts you track. The template reports the groups apart and gives a total row only as a reference.
Panel B splits by funnel stage. The question it answers is where in the buying process you appear: answers to problem-stage questions and to comparison-stage questions can differ a lot, and a rate that looks fine overall can hide an empty stage. Stages with few answers get wide ranges, and the Reading column marks them Too few answers to read.
Panel C splits by engine. Engines retrieve and cite differently, and answers to the same prompt vary from run to run even on one engine, which is the subject of why AI citations change between runs. Averaging engines together produces a number that describes none of them.
Panel D shows twelve months and compares each month with the one before using the two ranges. If the ranges overlap, it prints "Ranges overlap: treat as unchanged." It only says Higher or Lower when the ranges separate.
Panel E lists the most-cited domains from the optional Cited domains tab: your share of the citations you logged, and how much of the total the top three domains hold. The shares are shares of what you chose to log, not of all citations in AI answers.
Panels B to D follow a group selector at the top of the Dashboard, so you can read the non-branded group by stage, engine and month without the branded prompts mixed in.
Why every rate carries a range
Suppose a non-branded group is checked on 30 answers in March and 6 of them cite you: 20 percent. In April, 9 of 30 cite you: 30 percent. That looks like a 50 percent improvement. The 95 percent range around March runs from about 10 to 37 percent, and around April from about 17 to 48 percent. The two ranges overlap across most of their length, so the data cannot tell the months apart. The numbers in this example are invented, and the template does this calculation for you with the Wilson method for a proportion.
Ranges also show how many answers it takes to see a change. To tell 20 percent from 30 percent with the usual 80 percent chance of catching a real difference, you need about 385 answers in each period. That figure assumes every answer is an independent draw from a steady process, which is a best case, so the real requirement is higher. Most teams log far fewer answers in a month. How often to track AI search covers the collection side of the same problem.
When the numbers are too thin, three responses are reasonable. Pool several months into one quarterly figure. Narrow the prompt set to the groups that matter most so each one gets more answers. Or publish the wide range and say it is wide. The one response to avoid is reading the point estimate and ignoring the bar.
Where the numbers mislead
Citations pile up on a few domains. Kai-Cheng Yang analyzed about 24,000 conversations on a public AI search comparison platform and found that news citations concentrated on a small number of outlets: the top 20 news sources made up 67.3 percent of one provider's news citations, against 31.9 percent and 28.5 percent for two others (Yang, News Source Citing Patterns in AI Search Systems). An audit of four generative search engines by Mowafak
Allaham and Nicholas Diakopoulos describes "a somewhat narrow set of repeatedly cited domains" (AIES 2026). Yang's figures are about news outlets, and neither study set out to measure B2B software prompts, as far as the abstracts show, so read them as evidence that the pattern exists, not as a figure for your category. If your category behaves the same way, a few domains hold most of the citations and your share depends on displacing names that keep reappearing. Panel E shows whether your own log looks like that.
A citation is not proof the answer is supported. In a 2023 audit of four generative search engines, Liu, Zhang and Liang found that on average 51.5 percent of generated sentences were fully supported by their citations, and 74.5 percent of citations supported the sentence they were attached to (Evaluating Verifiability in Generative Search Engines). The engines have changed since, so treat that as a reason to open a sample of the pages cited in your answers, not as a current error rate. The template counts links. It does not check whether the answer says what your page says.
The prompt set decides the number. Add ten branded prompts and your blended rate rises with no change in anything you did. Change the wording of a prompt and you may be measuring a different question. Write down the date of every change to the prompt list, and do not compare across it without saying so.
The ranges are a floor on the uncertainty. Wilson ranges treat each answer as an independent draw. Answers to one prompt on one engine on one day resemble each other, so true uncertainty is wider than the bar. The dashboard measures appearing in answers, not visits. Visits from AI products that arrive with a source are a separate measurement, covered in how to track AI referral traffic in GA4. Do not add the two together or expect them to move in step.
Fill in the template in this order
- Open Settings. Enter your domain, keep or change the minimum answer count, and set the first month of the trend. Edit the lists of groups, stages and engines.
- Open Prompts and replace the grey examples with your own prompts, one row each, with a group and a funnel stage.
- Open Run log and delete the grey examples. For each answer you collect, open its source list and count the citations that point to your domain, and the citations in total. Decide once how to treat subdomains and repeated citations of the same page in one answer, write the rule on the Read me tab, and keep it for every run.
- If you want the most-cited domains panel, add one row on Cited domains for each citation you logged, and list the domains you want counted in the tally on the right.
- Set the example switch in Settings to N.
- Open Dashboard, choose a group, and read the Reading column before you read any rate.
How to report it
A monthly report line can carry everything the dashboard shows. Using the template's invented example rows: "Non-branded citation rate 18 percent (range 13 to 25) on 144 answers across 8 prompts and 3 engines, July to September. Branded 68 percent (57 to 78) on 72 answers. Your domain holds 8 percent of the citations logged. Months are indistinguishable: the ranges overlap."
Four habits keep a report like that accurate. Print the definition of the metric under it. Show the answer count beside every rate. Report branded and non-branded apart. Name the date the prompt set last changed.
Citation rate is an input measure, not an outcome. If you are choosing which number leads a scorecard, see the north star metric for B2B AI search on choosing one.
Frequently asked questions
What is AI citation share?
There is no independent standard definition. In this template, citation share is your citations divided by all citations in the answers you logged, and it sits beside two related measures: citation rate, the share of answers that cite you, and named-in-text rate, the share of answers that name your brand. Whichever you report, print the definition with it.
What is a good AI citation share?
We did not find an independent benchmark, and the right number depends on your category, prompts and engines. Compare each group with its own history, with the other groups in your log, and with competing domains you tally on the Cited domains tab, using ranges rather than single points.
How many answers do I need?
The template marks any row with fewer than 30 answers as too thin to read, which is our rule of thumb. To tell 20 percent from 30 percent reliably you need about 385 answers per period, assuming independent answers, so most teams will report wide ranges and should say so.
Can I use the data in a BI tool instead of a spreadsheet?
Yes. The run log is a flat table with one row per answer, which loads into most BI tools, and the Wilson range formulas on the Dashboard tab can be copied. Keep the group and stage lookups and the example flag so the same rules apply.
Should I count a brand mention as a citation?
No. A citation is a source link in the answer pointing to your domain. A mention is your brand named in the text. They behave differently, so the template keeps them in separate columns and separate measures.
Fill in the first twenty rows by hand
Pick five prompts, run each on two engines, and open every answer's source list. Repeat the same ten checks on a second day, so you have twenty rows. Count the citations yourself, switch the example rows off, and read the Dashboard. You will see the answer count under every rate and which panels are still too thin to read, which is the useful lesson before you decide how much to automate.
Collecting rows by hand is the slow part. If you want a first reading on one prompt before you start a log, the AI Search Visibility Checker gives you one. If you track prompts one at a time over months, AI Search Intelligence tracks individual prompts, and the template's definitions give you a way to check any number you see against your own count.