


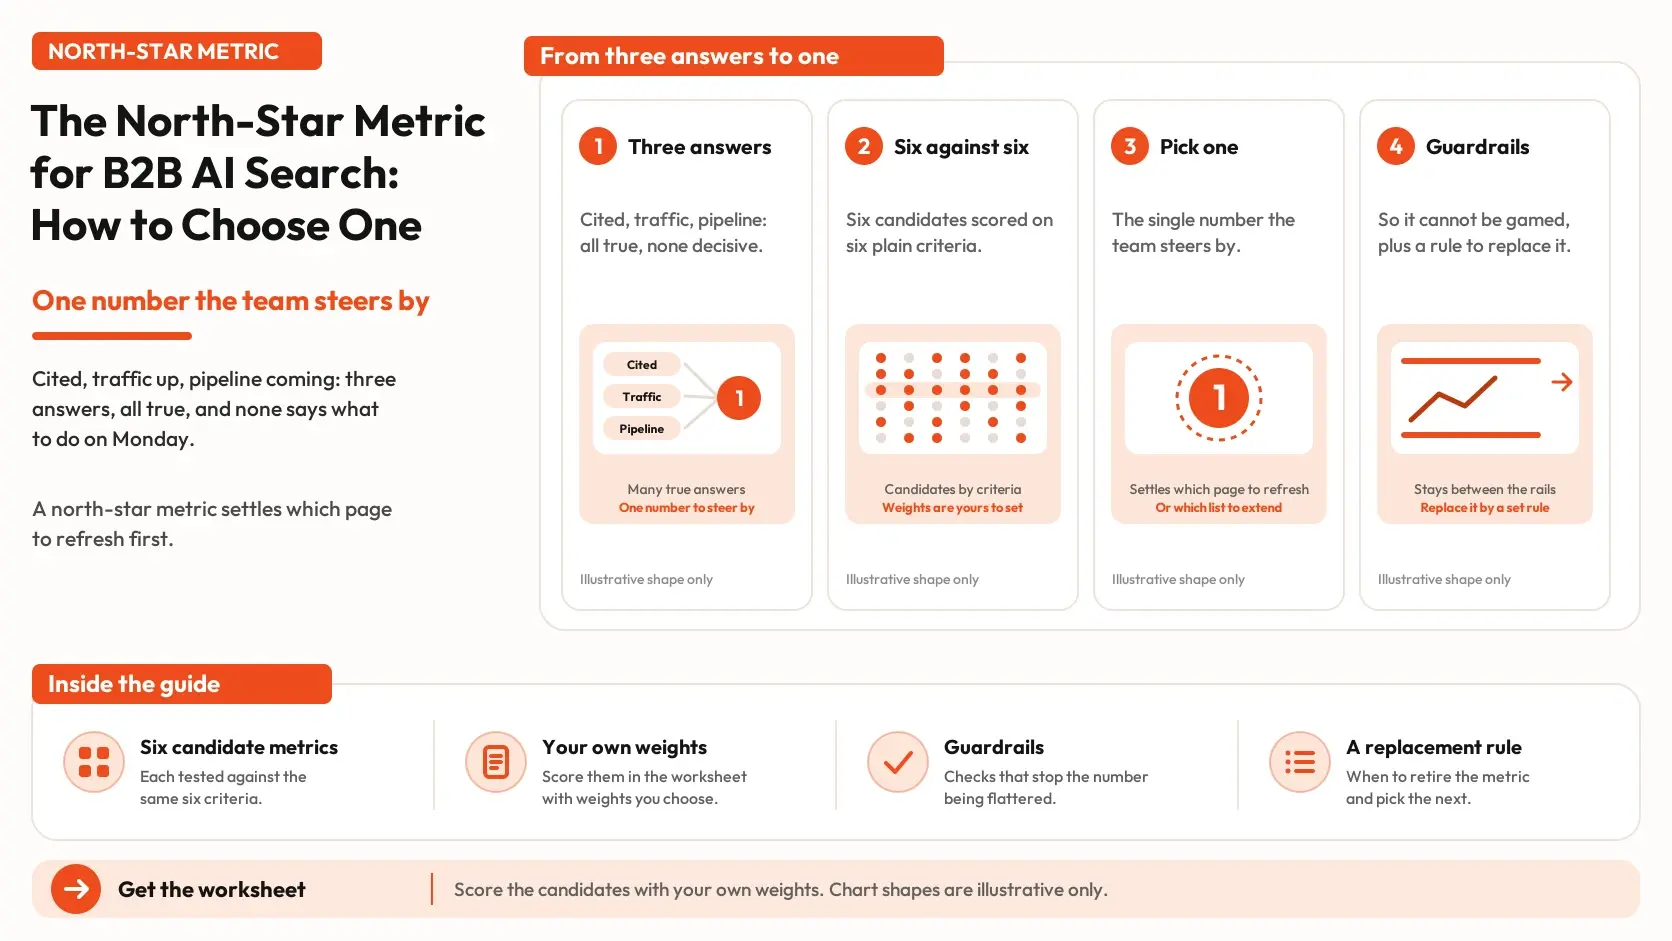


AI search teams track citations, traffic, and pipeline, but which metric should guide their decisions?
This guide evaluates six north-star metric candidates against six criteria to help you choose the right one, set guardrails against misleading gains, and define when to switch to a revenue-focused metric. Use the included worksheet to score each candidate based on your team’s priorities.
Why one number, and why never only one
There is a real argument against a single metric. In their 1992 Harvard Business Review article on the balanced scorecard, Kaplan and Norton argued that no single measure covers the critical areas of a business, and that a short set of measures lets managers see when a gain in one area comes at the cost of another. Their comparison was to a pilot, who watches fuel, airspeed, altitude and bearing together.
There is also an argument against too many numbers. A team that reports ten measures with equal weight cannot say which one wins when they conflict. The way through is to give the numbers different jobs. One metric steers: it decides what the team does next. A few others guard: they tell you when the steering metric is improving for the wrong reason. A report that has a steering metric and three guardrails is short enough to read and broad enough to catch a bad trade.
The guardrails matter because of how metrics fail under pressure. Manheim and Garrabrant, in a 2018 paper on the variants of Goodhart's law, describe what happens when a metric is optimized so hard that further gains stop being effective or become harmful. A team rewarded on a number will find the cheapest way to move it. For AI search, the cheapest way is usually to change what you are measuring.
What a north-star metric has to do
Here are six tests. They are our synthesis, not a published standard, and they are written for the practical question of whether a team can steer by the metric.
- It is tied to a buyer outcome. It should sit close to something a buyer does or sees, not to an internal activity such as pages published.
- It has a stated method. Two people measuring it on the same day should get the same number, or at least know why not.
- Your work moves it. If the number moves mostly because of things you cannot influence, nobody can steer by it.
- It is readable within a quarter. You need enough events that a change is more than noise.
- It is hard to game. A team under pressure cannot improve it by changing the question.
- Leadership can see why it matters. If it takes a ten-minute explanation, it will not survive a budget meeting.
Six candidates, scored
Here are the six candidates most B2B teams consider, with how each is measured and where it falls short.
| Candidate | How you measure it | Where it falls short |
|---|---|---|
| Cited rate on your buyer-question list | Run a fixed list of questions, log whether your pages are cited, divide by runs that returned an answer | Sampled, not a census; answers vary between runs, so it needs run counts and ranges |
| AI-referred visits | Analytics, using the AI Assistant channel or referral filters | A floor: it excludes Google's AI features and misses answers that do not produce a click |
| Self-reported "found us in AI" leads | A source question on forms and in sales notes | Few responses in a quarter; depends on people remembering and answering |
| AI share of voice against named peers | Your cited rate relative to a set of peers on the same questions | Depends on who you pick as peers and which questions you track; it moves when they move |
| Search Console AI impressions | Google's generative AI performance report | Shows links displayed, not buyers influenced; no queries, no position, clicks not described |
| AI-influenced pipeline | Tagged opportunities where AI was a reported source or touch | Small counts and slow cycles; attribution is soft |
On the first of these, the term "cited" means one of your pages appears among the source links in an answer. We cover the logging method in how to track your AI Overview rankings, and the same approach works for any answer engine you choose to sample. The grid below scores each candidate from 0 to 2 on the six tests.
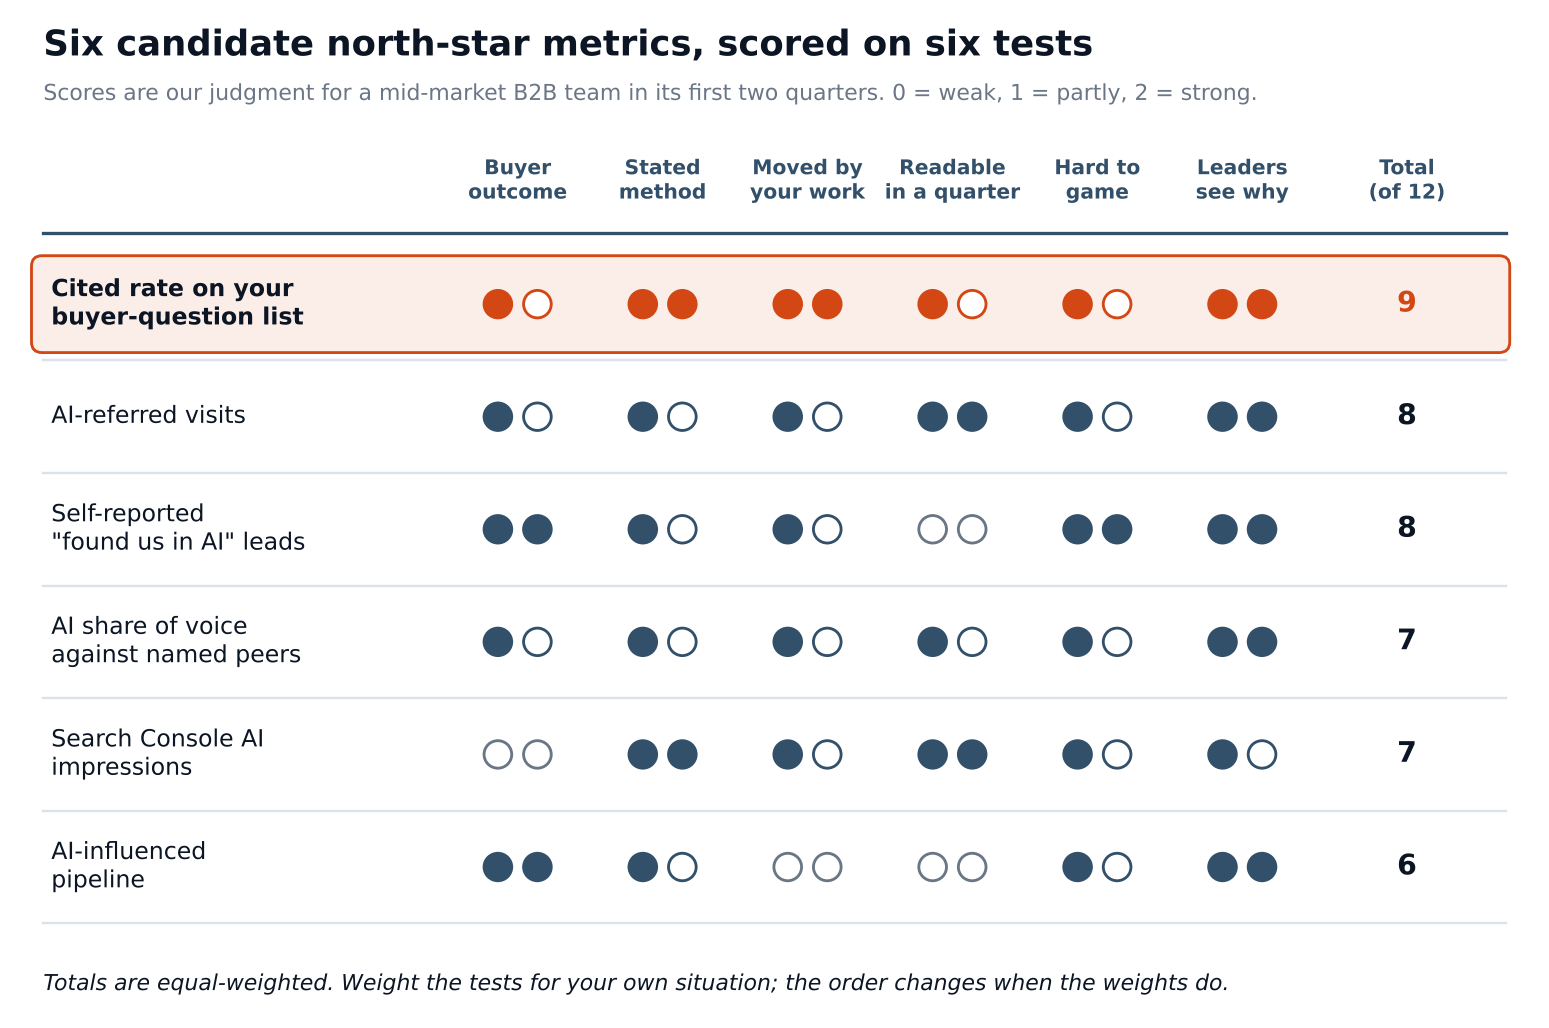
Treat the totals with care. They are our judgment for a mid-market B2B team in its first two quarters of AI search work, and the gaps are small. What the grid does show is the pattern: the metrics closest to revenue are the hardest to read quickly, and the metrics that are easy to read sit furthest from the buyer.
Score the candidates for your own team
The worksheet holds the same six candidates and tests, lets you change the weights, and ranks the result. A team selling to a short list of named accounts might weight "tied to a buyer outcome" higher and "readable in a quarter" lower. A team with high web traffic might do the reverse. Change the weights, and keep the one that survives an argument.
Our pick for most teams: cited rate on a buyer-question list
For most B2B teams starting out, we suggest cited rate on a fixed buyer-question list as the steering metric. It is the closest to your own work, it has a method you can write down, and it can be read within weeks rather than quarters. Its main weakness is distance from revenue, and the guardrails below are there to cover it.
Write it as a definition anyone can check:
Of the runs that returned an AI answer for our buyer-question list, the share that cited at least one of our pages, with the number of runs and a range.
Four choices inside that definition decide whether it holds up.
The list is fixed and versioned. Twenty to forty questions, in the exact wording buyers use, tagged by buyer stage. If you add or reword questions, you have started a new version, and you do not compare across versions. Our buyer prompt library is a place to start building the list.
The denominator is runs that returned an answer. If a question never produces an AI answer, it should not drag the rate down.
Branded questions are reported separately. A question that includes your company name will cite you far more often. Mixing them into the same rate makes the number look better without any change in how buyers find you.
The rate is never reported without its run count and range. A cited rate of 30 percent over 10 runs and 30 percent over 120 runs are different facts. Answers can differ between runs even with identical settings, which is why the model variability piece recommends repeated runs. Write "36 of 120 runs (30 percent, range 23 to 39 percent)", not "30 percent".
Guardrails: three numbers that keep it in check
A steering metric needs company. Here are the three we would pair with cited rate, each chosen because it fails in a different direction.
AI-referred visits, as a floor. Google's Analytics Help describes an AI Assistant channel for visits from sources such as ChatGPT, Gemini, Copilot and Grok, and says that channel excludes Google's AI Overviews and AI Mode, which are counted under Organic Search. So the number is a floor, not a total. If your cited rate climbs for two months and referred visits do not move at all, ask why before you celebrate. Pew Research Center found, in a study of March 2025 Google browsing data, that users clicked a result link in 8 percent of visits with an AI summary against 15 percent without one, so some gap between presence and visits is expected. A flat line for a long time is still worth a question.
Self-reported source, as a reality check. Add a "how did you hear about us" field to your forms and a line in sales notes. When a buyer writes "asked ChatGPT", that is a buyer outcome the other numbers cannot see. It will be sparse and it will undercount, but it is the guardrail leadership will believe.
Answer accuracy, as a quality check. Once a month, read ten of the answers that cited you and mark each one as accurate, partly accurate or wrong about what you do. A rising cited rate with wrong descriptions is a loss, not a win.
Add one rule on top: the list does not shrink or drift. Log every change to the list. A cited rate that rose because three hard questions were swapped for easy ones has not risen.
When to change the north star
A north star is not permanent. As your program matures, a metric closer to revenue becomes readable, and at that point the steering metric should move toward it.
The test is whether the count behind the new metric is large enough to read. Take tagged opportunities, meaning opportunities where a buyer or a rep reports that AI answers were a source or a touch. If you tag 5 in a quarter, the exact Poisson 95 percent interval says the underlying quarterly count could plausibly be anywhere from about 2 to 12. At 20 it is about 12 to 31, and at 40 it is about 29 to 54.
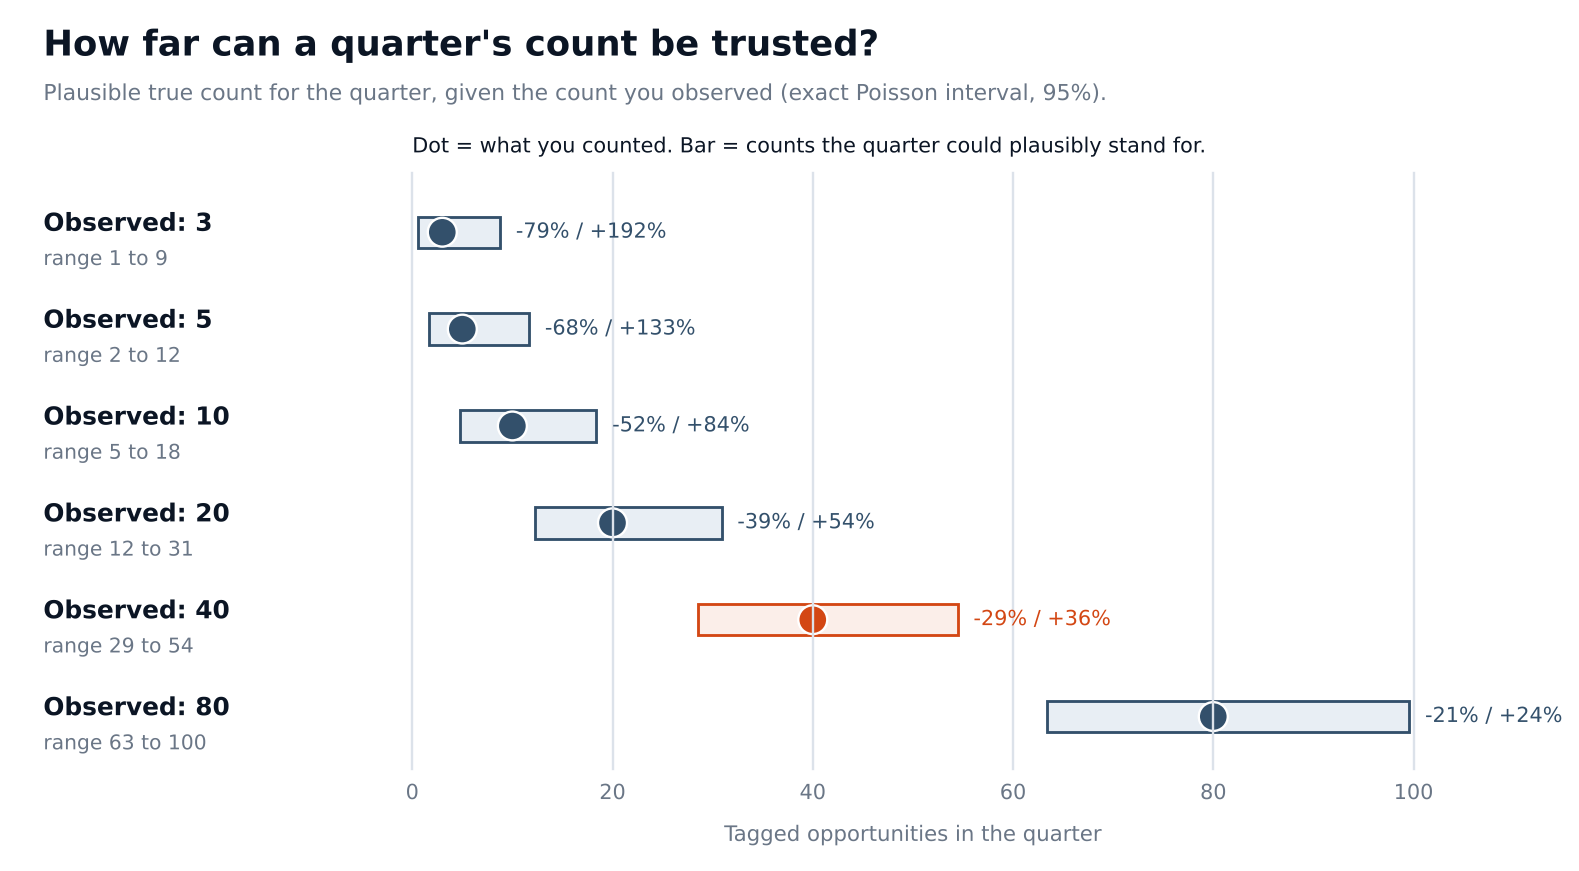
A practical reading: if you want a quarter's count to be within about 30 percent either way of the underlying rate, you need about 50 tagged opportunities in that quarter (at 40 the average half-width is still about 32 percent). That is our rule of thumb from this arithmetic, not an industry standard, and your tolerance may differ.
Many B2B teams will not reach that number every quarter, and that is fine. It means pipeline should not be the steering metric quarter to quarter. It can still be the validation: a yearly or cumulative count that tells you whether the work behind cited rate has been showing up in the sales process.
So the switch rule is:
- Stay on cited rate while tagged opportunities are too few to read.
- Add tagged opportunities as a validation line once you have a few per quarter, and watch whether it moves in the same direction as cited rate over two or three quarters.
- Move the north star to a pipeline measure only when the quarterly count is large enough that you would act on a 30 percent move.
For the revenue side of that chain, see how to forecast AI search ROI and the AEO business case.
Put it on one line
A north star only works if it appears in the same place, in the same form, every time. Here is a monthly line that holds all of it:
"Month 3: cited rate on non-branded buyer questions, list v1: 36 of 120 runs (30%, range 23 to 39%), against 24 of 120 last month (20%, range 14 to 28%). AI-referred visits: floor of 140, up 10%. Self-reported AI source: 4 leads. Accuracy check: 8 of 10 accurate. List unchanged."
Every number there is an invented example. The point is the shape: the steering metric first, the run counts and range beside it, the three guardrails after, and a line confirming the list did not change. Notice that the ranges in this example overlap, so the fair reading is "probably up, not yet proven". Say that in the report.
FAQ
Should the north star just be pipeline? For most teams, not yet. Pipeline is the right thing to care about, but the quarterly counts behind it are usually too small to steer by. Use it to validate, and move to it when the counts support it.
Can we use share of voice as the north star?
You can, if you pick the peer set and the question list once and keep them fixed. Be aware that it moves when your peers move, which can make a good quarter look flat or a bad one look fine.
Should we have one north star per answer engine?
No. Keep one north star for the team and let the engine breakdown sit underneath it as a diagnostic. If you split the steering metric by engine, the team has several numbers to chase and no tiebreaker.
How often should we review it?
Report monthly and decide quarterly. Monthly lines show whether the list and the method are holding. Quarterly is when to ask whether the north star itself still fits.
Is cited rate the same as an AI Overview ranking?
No. An AI Overview does not have a rank position that Google reports in Search Console, so we count presence as a cited-or-not result per run. Our guide to tracking AI Overview rankings explains the difference.
Pick the metric before the dashboard
Do this before you build any report. Write the definition of your north star in one sentence, name the three guardrails, and put a review date on the calendar. A team that does this in an afternoon has more clarity than one that has a dashboard with forty tiles.
If you want a first reading to set your starting cited rate, the AI Search Visibility Checker gives you a baseline to write down on day one. When the list needs to stay fixed and the runs need to happen on schedule, AI Search Intelligence tracks each of your prompts individually, so the number you steer by is the same number next quarter. And if you are still deciding whether to invest, start with is AEO worth it.