


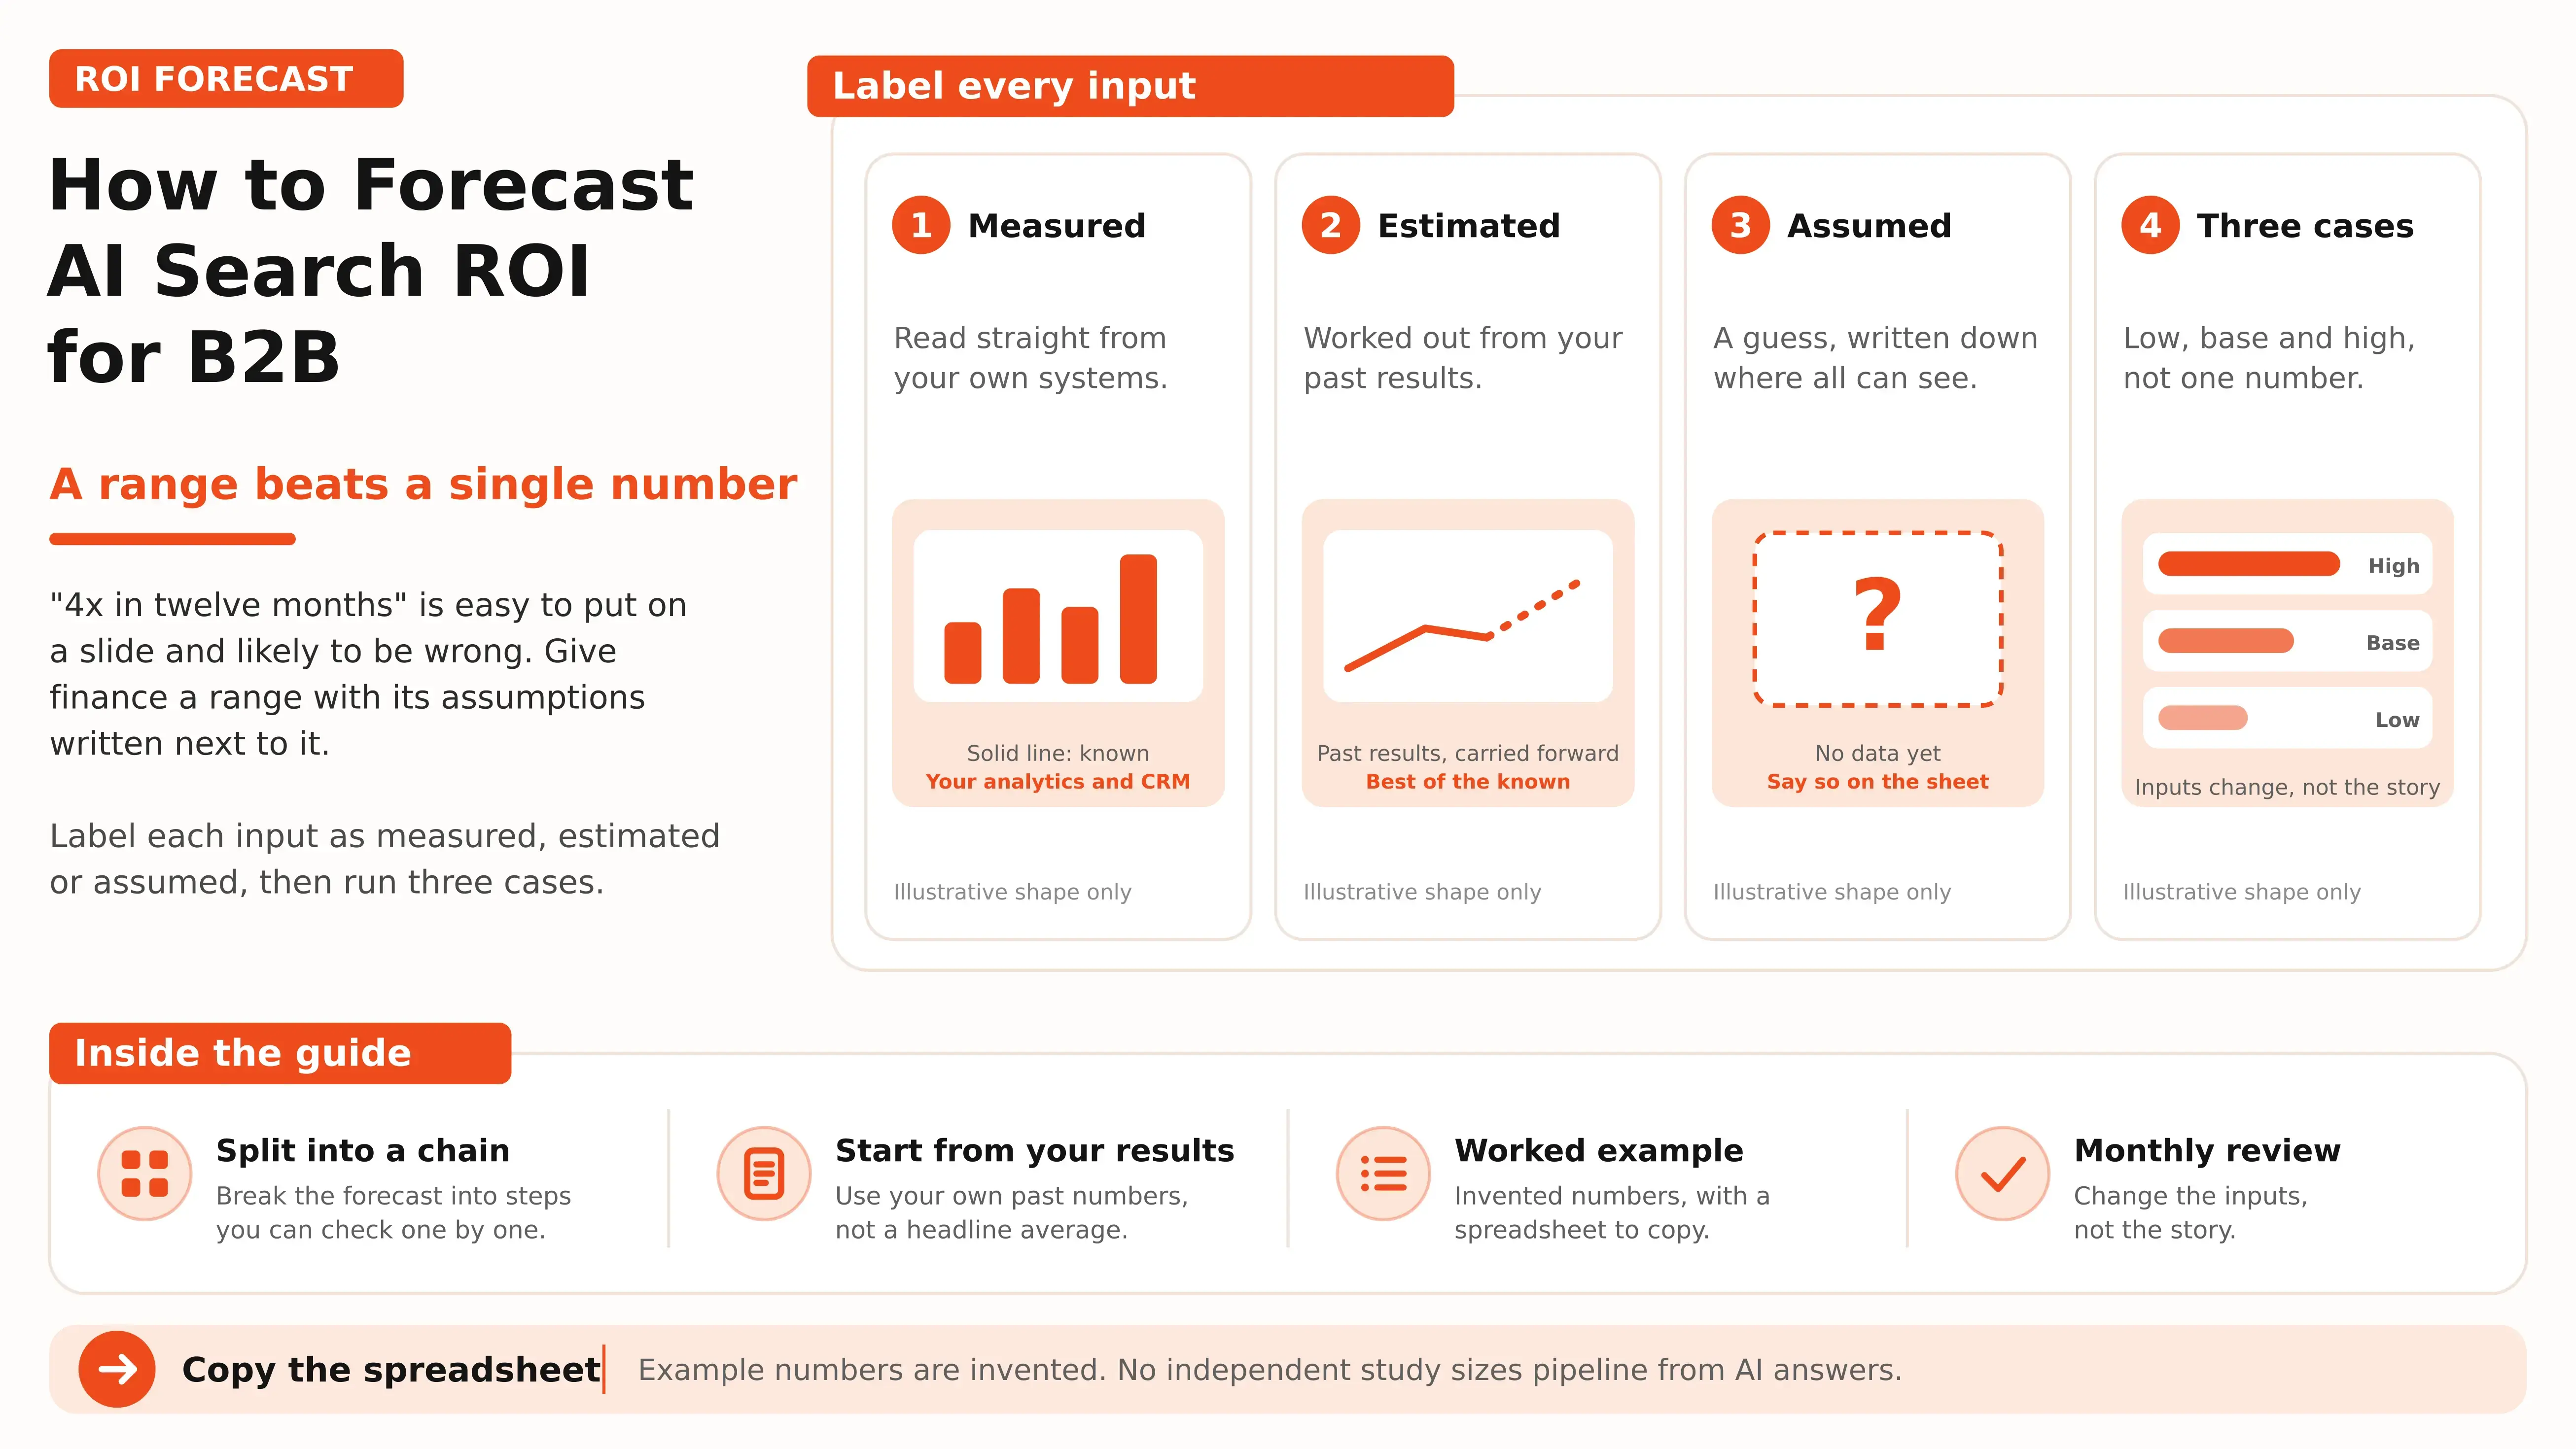


Forecasting AI search ROI for B2B requires more than a single return estimate or payback date. This guide explains how to build realistic ROI forecasts for AI search and SEO using low, base, and high scenarios, clearly defined assumptions, historical performance data, and monthly reviews. Since there is no independent study that quantifies AI search’s contribution to B2B pipeline, the goal is to separate what you can measure from what you need to estimate.
Why one number is the wrong answer
A forecast is a claim about the future, and the future has spread. Rob Hyndman and George Athanasopoulos, in their open forecasting textbook, put it bluntly: "point forecasts can be of almost no value without the accompanying prediction intervals." They also note that intervals usually get longer as the forecast horizon grows. Both points apply directly to marketing. A twelve-month number carries more uncertainty than a three-month one, and a 24-month number carries more still.
Search programs add three sources of spread on top of that. The first is that the chain is long. Revenue from search is the product of several links multiplied together, and a modest miss on each link compounds. A 20 percent shortfall on each of traffic, conversion and deal size leaves about half the revenue, not 80 percent of it. The second is delay. In B2B, a visit today becomes revenue months later, after a sales cycle you do not control. A program can be working and still show nothing in the pipeline report for a quarter. The third is that AI search is new enough that your own history is thin. You may have three years of organic search data and three months of anything about AI answers.
A range handles all three. It tells the reader which way the answer can break, how far, and what would have to be true for each outcome.
Write the forecast as a chain
Start by drawing the path from being visible to being paid. For both organic search and AI answers it has six links: visibility, exposure, visits, leads, pipeline and revenue. Each link is a number you either have or do not.
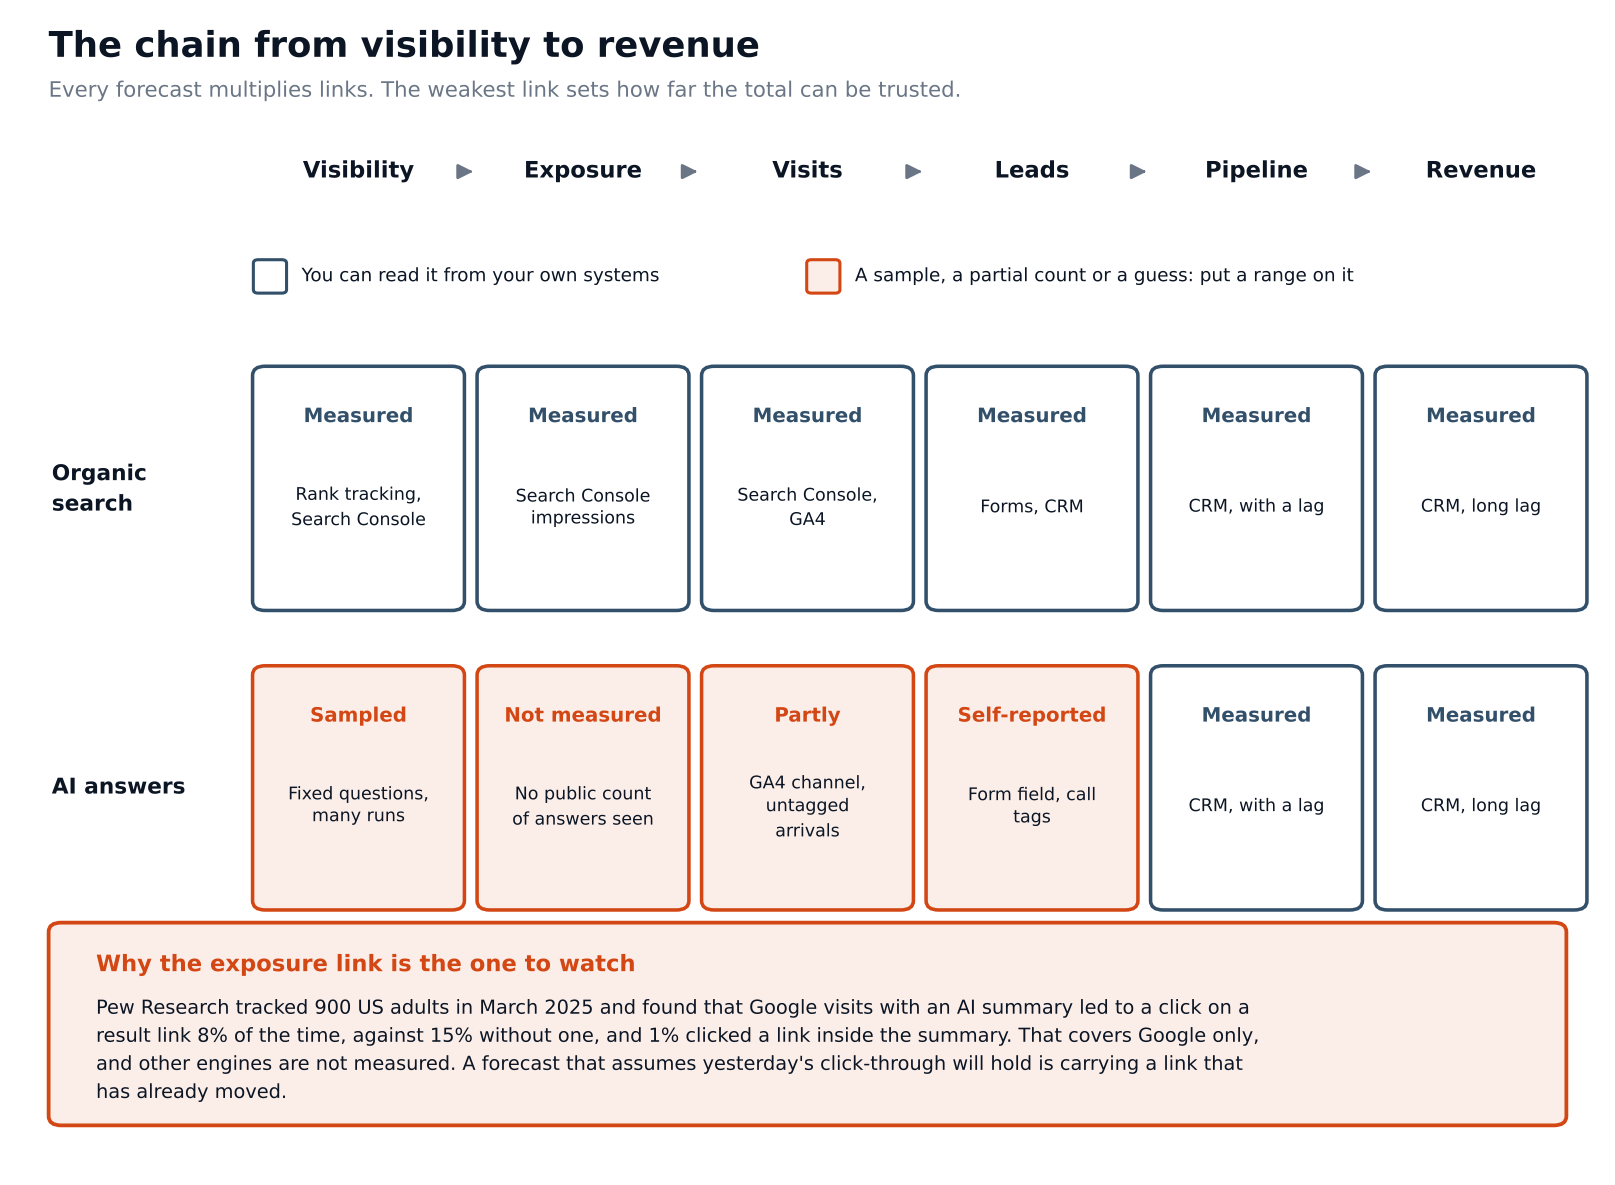
For organic search, you can read every link from your own systems or from Search Console. For AI answers the picture is different. Visibility is something you sample: you run a set of prompts and record whether and how your brand appears. Exposure, meaning how many people actually saw that answer, is not measured by anything we know of for most B2B brands. Visits can be partly measured through referral traffic, though not all AI products pass a referrer. Leads can be asked about directly with a self-reported attribution field. Pipeline and revenue are measured once the lead is in your CRM.
The exposure link is the one to watch, and the best independent evidence on it is limited but useful. In March 2025, Pew Research Center tracked the browsing of 900 US adults and looked at 68,879 Google searches. About 18 percent of those searches, 12,593, showed an AI summary. People clicked a result link in 8 percent of visits with an AI summary and in 15 percent of visits without one. They clicked a link inside the summary itself in 1 percent of visits.
They also ended their browsing session after 26 percent of visits with a summary, against 16 percent without. This is Google only, a single month, US adults, and Pew re-collected the summaries in April 2025, so it describes one product at one time. It still shows why you cannot treat being shown as the same thing as being visited. Being seen in an answer and a click on your site are different events, and your forecast should not assume one converts into the other at a fixed rate.
Two practical rules follow. Forecast from the links you can measure, and put your guesses in the links where the chain is thinnest rather than spreading them everywhere. And never multiply a sampled number by an assumed number and present the product as if it were measured.
Label every input: measured, estimated or assumed
Before you set any value, give each input one of three labels.
Measured means it comes from your own systems for a comparable thing. Your lead-to-opportunity rate, win rate and average first-year contract value are usually measured, because your CRM holds them. Program cost is measured too, once you add the content, tooling and people time.
Estimated means it is based on a sample or on a past result you are carrying forward, so it has error bars you can at least describe. Your visit-to-lead rate on comparable pages is an estimate. So is a sales cycle length taken from the median of closed deals.
Assumed means a judgment with no direct source. Steady monthly visits from AI answers is an assumption for most B2B teams. So is the share of wins that would not have happened without the program, and so is how fast traffic ramps.
The labels do two jobs. They tell the reader where to push back. And they tell you where to spend effort: moving an input from assumed to estimated, or from estimated to measured, is worth more than polishing a link that is already measured. If more than half your inputs are assumed, say so at the top of the forecast. That is useful information, and a finance partner will trust the rest of the page more for it.
Start from your own history
The outside view is a forecasting habit that fits this problem well. In a McKinsey conversation with Tim Koller and Dan Lovallo on taking the outside view, the idea is to start from a set of comparable past cases and ask how they turned out, instead of building an estimate from the details of the case in front of you. Plans built from the inside, from what we intend to do and why it will work, tend to run optimistic. The remedy they describe includes agreeing on the reference cases before you look at the answer, and having someone independent check them.
For a search program, your reference class is your own record. Pull what happened the last time you published a comparable cluster:
- How many months until the first page in that cluster got steady traffic?
- What visit-to-lead rate did those pages reach?
- What did those leads do in the CRM: how many became opportunities, how many closed, and how long did it take?
Use those as your base values and write down which pages you used. Then choose the low and high values from the spread in those cases, not from how you feel about the new program. If your last three clusters took four, six and nine months to ramp, then ramp of 4, 6 and 9 months is a defensible range. Ramp of 2 months is a wish.
Where you have no history, for example AI answer visits, say so and use a wide range. Our guide to measuring early-stage influence in AI search journeys covers why the first touch often leaves no trace, which is one reason the range for that link should be wide.
A worked example with invented numbers
Here is a forecast for an invented B2B software company. Every number below is made up to show the mechanics. None of it is a benchmark, an average or a prediction for any real company.
The program costs $15,000 a month in all three cases. The inputs are:
| Input | Low | Base | High | Type |
|---|---|---|---|---|
| Steady monthly visits from AI answers | 1,500 | 2,500 | 3,000 | Assumed |
| Visit-to-lead rate | 1.2% | 1.5% | 1.7% | Estimated |
| Lead-to-opportunity rate | 13% | 15% | 16% | Measured |
| Opportunity-to-win rate | 20% | 22% | 24% | Measured |
| First-year contract value | $27,000 | $30,000 | $33,000 | Measured |
| Incremental share of wins | 55% | 70% | 85% | Assumed |
| Months to reach steady visits | 9 | 6 | 5 | Assumed |
| Sales-cycle lag in months | 6 | 4 | 3 | Estimated |
The model is simple. Visits ramp up in a straight line to the steady level. Each month's visits become leads, opportunities and wins at the rates above. Revenue arrives after the sales-cycle lag, and only the incremental share of it counts. Net is cumulative counted revenue minus cumulative cost.
In the base case, 2,500 visits at 1.5 percent give about 37 leads a month. At 15 percent that is about 5.6 opportunities, and at 22 percent about 1.24 wins a month. At $30,000 and 70 percent incremental, each steady month adds about $26,000 of counted revenue against $15,000 of cost.
Run all three cases and the picture looks like this:
| Case | Wins per month at steady state | Net at month 12 | Net at month 24 | Payback |
|---|---|---|---|---|
| Low | 0.47 | about -$164,000 | about -$263,000 | None inside 24 months |
| Base | 1.24 | about -$37,000 | about +$95,000 | Month 16 |
| High | 1.96 | about +$205,000 | about +$684,000 | Month 7 |
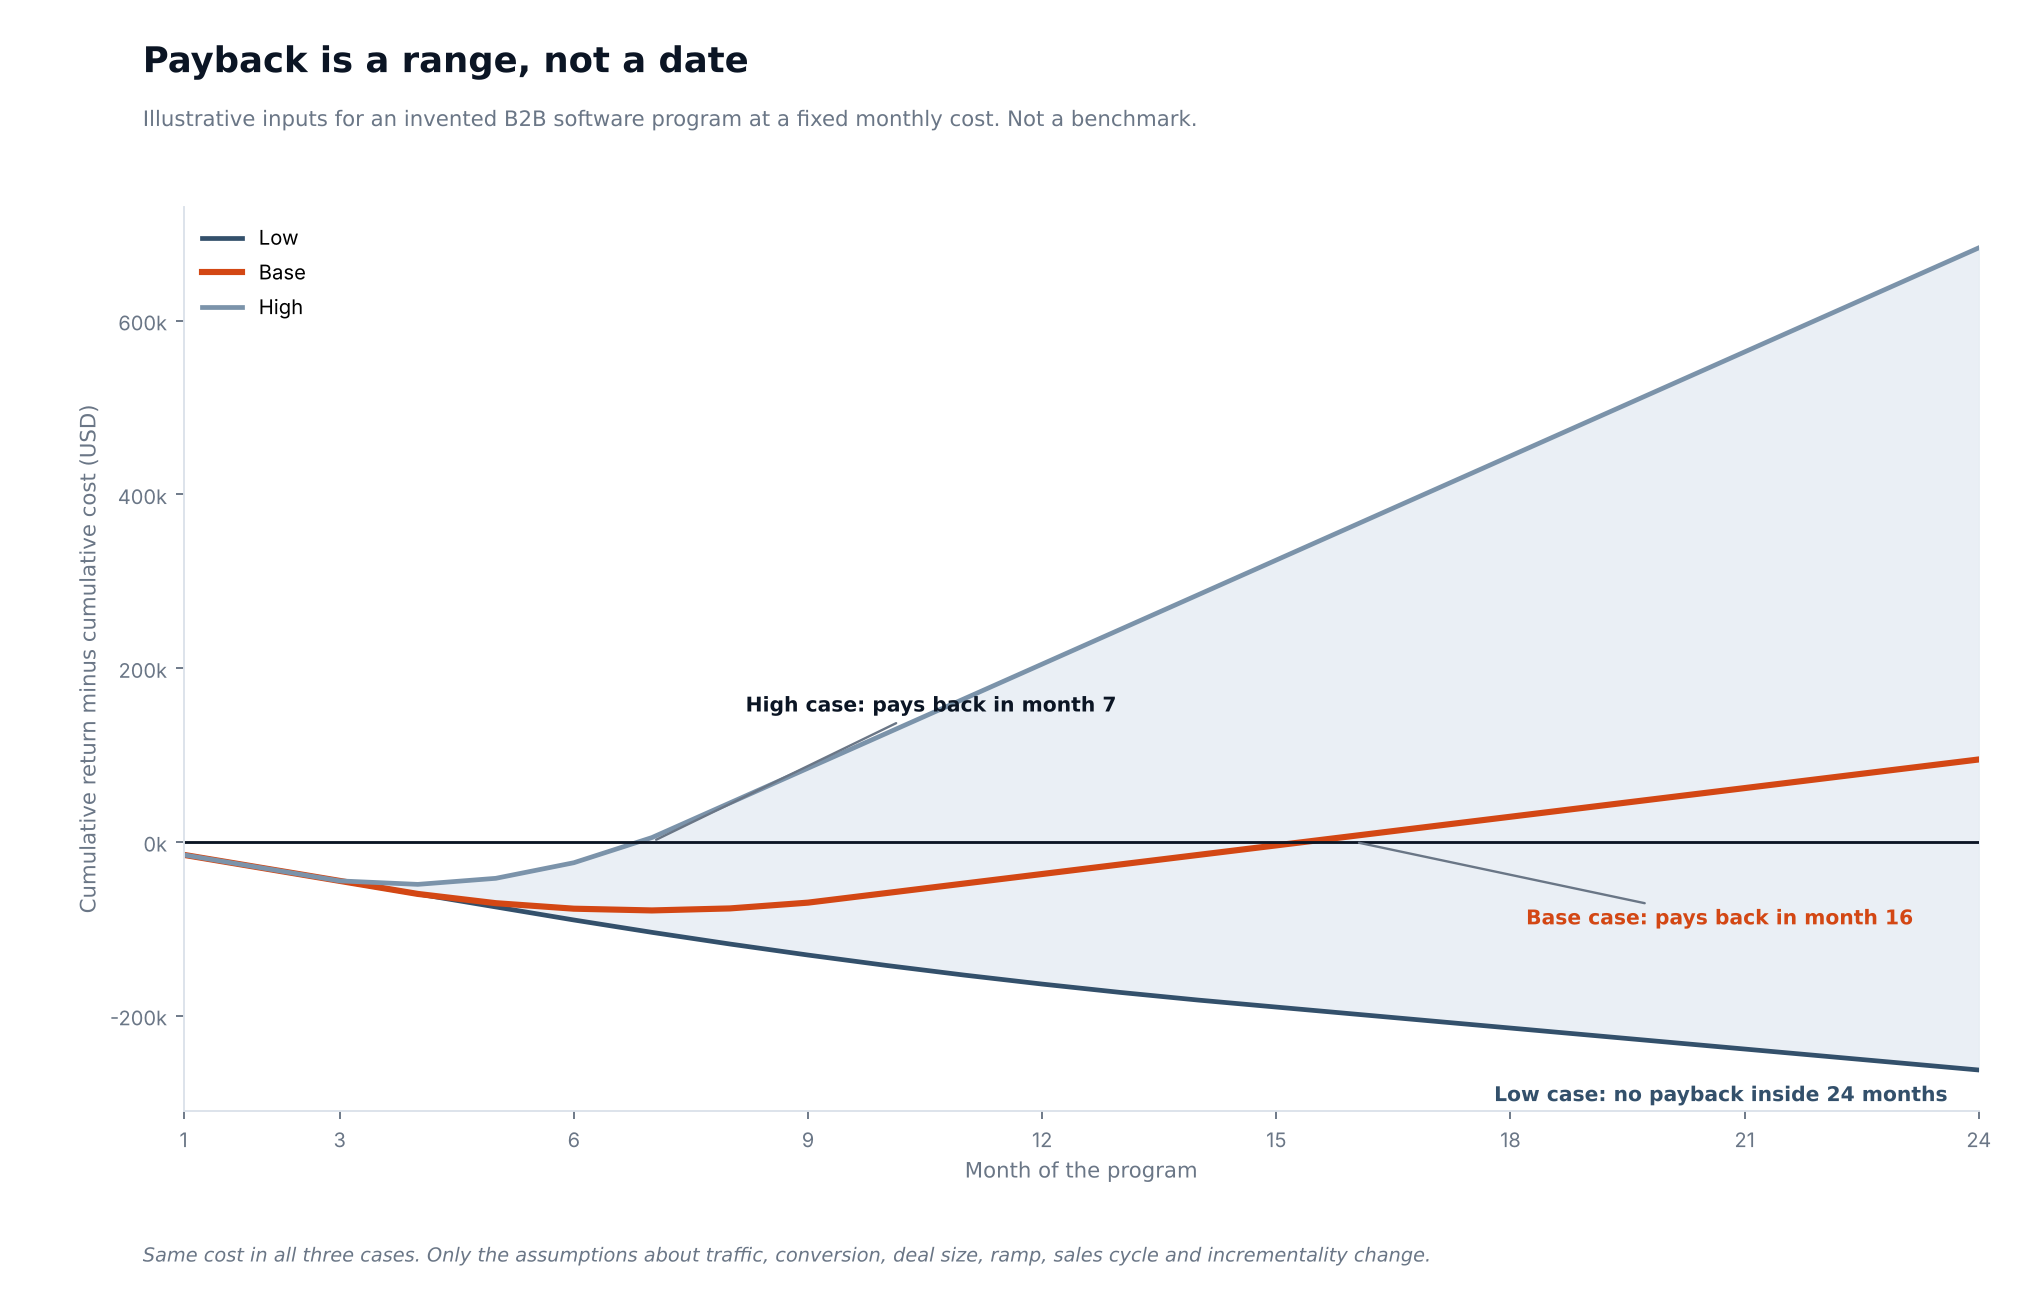
Read it for what it teaches, not for the figures. Most inputs sit within 10 to 20 percent of the base value and none is more than 50 percent away, yet the outcomes run from a large loss to a large gain. Payback sits at month 7, month 16 or nowhere. A single point forecast would hide that, and it would hide it in the direction that makes the plan look safe.
The example also shows which inputs deserve your attention. Change one input at a time from the base case to its low or high value and watch net at month 24: steady monthly visits moves it by roughly $180,000 down or $90,000 up, the incremental share by about $97,000 either way, and the visit-to-lead rate by $60,000 to $90,000. Contract value and win rate move it by about $40,000 to $45,000 each way. The two biggest swings come from inputs labeled assumed. That is a common shape: the part you can read from your CRM is steadier, and the part you cannot is where most of the forecast's uncertainty sits.
To try your own numbers, open the template and change the blue cells on the Inputs tab. The three scenario tabs and the summary update from there. The template uses the same invented values until you replace them.
Decide what counts as revenue
A forecast is only as good as its definition of return. Four choices matter more than the others.
1. Incrementality
Not every deal that touched the program was caused by it. Some buyers would have found you anyway. The incremental share in the example is the fraction of wins you believe would not have happened without the program. It is a judgment, and it should be the first thing you test (see below). Do not set it to 100 percent because the deal had a touchpoint.
2. First-year versus lifetime value
Count first-year contract value unless your finance team agrees on a way to count renewals. Counting lifetime value in the forecast makes payback look faster and moves the uncertainty into churn assumptions that are not part of this program.
3. Margin
If finance reviews gross margin, convert revenue to margin before comparing it with cost. The template leaves this out to keep the chain readable, and so it overstates the return for any business with meaningful cost of goods.
4. Shared credit. Search programs rarely work alone. Sales, paid media and events can all be in the same deal. Pick a rule, such as a share of each deal you credit to the program, and keep it for the whole forecast. Changing the rule mid-year is a way of changing the answer.
Our piece on the dark AI search funnel explains why a large part of AI-influenced demand will show up as direct traffic or branded search, and why a self-reported attribution field is worth adding to your forms. Do not wait for a perfect attribution model before you write the forecast. Write the forecast with the rule you have and say what the rule misses.
Forecast the leading indicators you can promise
Revenue is the last link and the slowest. Before it moves, a set of earlier signals can show whether the chain is working. These are the ones to forecast with more confidence, and to report monthly:
- Sampled cited rate, with the run count. Out of a fixed prompt list, in what share of runs does your brand or page appear? Report how many runs sit behind the number. A rate from ten runs and one from a thousand are not the same kind of evidence, and answers vary from run to run. Our piece on model variability in AI citations covers why. Use a fixed list such as the one in our B2B buyer prompt library so the wording does not drift.
- AI-referred visits. Set up a channel in your analytics that collects visits from known AI assistant referrers. Treat it as a floor, because some visits arrive with no referrer at all.
- Self-reported attribution. A free-text or dropdown field on demo and contact forms asking how the person first heard of you. Tag the answers that mention an AI assistant.
- Call and meeting tags. Ask sales to tag first-call notes where the buyer mentions an AI answer.
- Search Console. Google's documentation said AI feature traffic is included in the Web search type in Search Console, and Search Engine Land reported on August 31, 2026 that Google has rolled out AI performance reports to all accounts. By that report, the data covers impressions, pages, countries, devices and dates and does not include click data. Check Google's current documentation before you rely on either description, because this part is changing.
AI Search Intelligence can track each prompt in your list individually, so the sampled cited rate comes from a fixed set of questions rather than a one-off check. A spreadsheet and a calendar reminder can do the same job at a smaller scale.
Promise leading indicators with confidence, and revenue with a range. If your sampled cited rate is climbing and your self-reported mentions are rising, the base case is gaining support. If both are flat after the ramp period you gave, move toward the low case early rather than waiting for the pipeline report to say so.
Test the assumption that matters most
The input that changes the answer most is usually incremental share, and it is the one least likely to be measured. There is a well-established way to measure incrementality in advertising: randomly assign regions to a treatment group and a control group, and compare outcomes. Google researchers Jon Vaver and Lizy Koehler described this "geo experiment" approach for ads in 2011. The method needs control over what each region sees, which you have with paid ads and do not have with AI answers. No study we found applies it to AI search visibility.
That does not leave you with nothing. Some tests are within reach:
- Matched pages. Update a set of pages and leave a comparable set alone, then compare the change in AI-referred visits and sampled cited rate. This is a comparison, not a randomized trial, and the pages you choose to update may differ in ways that affect the result. Choose by rule, such as every other page in an ordered list, before you see any data.
- Before and after on one cluster. Record the sampled cited rate and visits for a cluster, publish the change, and record again, with the same prompts and the same number of runs. Other things change in the same period, so say what else happened.
- Ask the buyer. For deals that closed, compare what the self-reported field said with what the CRM touchpoints say. Large gaps tell you where your credit rule is off.
None of these proves causation. All of them narrow the range on incremental share, which is what you want. Write the result back into the inputs and say which test it came from.
Review monthly, and change the inputs
A forecast that is never revisited turns into a promise. Set a monthly review and keep it short.
- Put the forecast value and the actual value for each leading indicator side by side.
- Mark which case the actual fell in: below low, between low and base, between base and high, or above high.
- For every input that missed, change the input and write down why. Do not change the conclusion without changing an input.
- Keep the old versions. A forecast you can only see in its latest form cannot be learned from.
Two habits keep the review from drifting. Do not move the high case upward to match a good month, since one strong month is a draw from the range and not a new range. And do not drop the low case because the program seems to be going well. The low case is there to remind you what the plan looks like if the assumed inputs fail.
If your list of tracked prompts changes, start a new series and label the break. Our guide to tracking AI search by buyer persona, ICP and funnel stage shows how to tag prompts so a change in the list does not look like a change in visibility.
Questions people ask
What is a realistic ROI for AI search?
No independent source gives one for B2B, so any figure quoted without a method behind it deserves caution. Build the range from your own cost, conversion rates and sales cycle, and let the low case show you what failure would look like.
Should AI search and SEO be forecast together or separately?
Use one chain with two rows, as in the diagram, because they share content, costs and often the same pages. Keep the inputs separate so you can see which row is carrying the result. If the AI row is mostly assumed, the forecast should say so.
How long before I can expect results?
Use your own history for organic search and a wide range for AI answers. The example uses a ramp of 5 to 9 months and a sales-cycle lag of 3 to 6 months, both invented. Your CRM will tell you the second one. Your last comparable content cluster will tell you the first.
How many prompts do I need to track for a forecast?
There is no specific number. Start with a fixed list that covers every stage of the purchase, run each prompt several times, and report the run count with every rate. The prompt library is one way to build the list.
What if finance wants one number?
Give the base case and show the range beside it. Say which inputs are assumed. If they still want one number, give the low case as the commitment and the base case as the plan.
Is the template free?
Yes. It is a spreadsheet with invented example values and formulas you can read. Replace the blue cells with your own.
Write the forecast on one card
You do not need a long document. Put the forecast on a single page that holds the chain, the three cases, the label on each input, the three leading indicators you will report monthly, and the date of the first review. If a reader can see in one glance which numbers are measured and which are guessed, the forecast has done its job.
Then check where you stand today. The AI Search Visibility Checker gives a first read on whether your brand appears in answers to buyer-style questions, which tells you whether the starting point for your sampled cited rate is near zero or not. Once you have a baseline, a tool such as AI Search Intelligence can hold the prompt list steady and keep the history, so each monthly review compares like with like.