


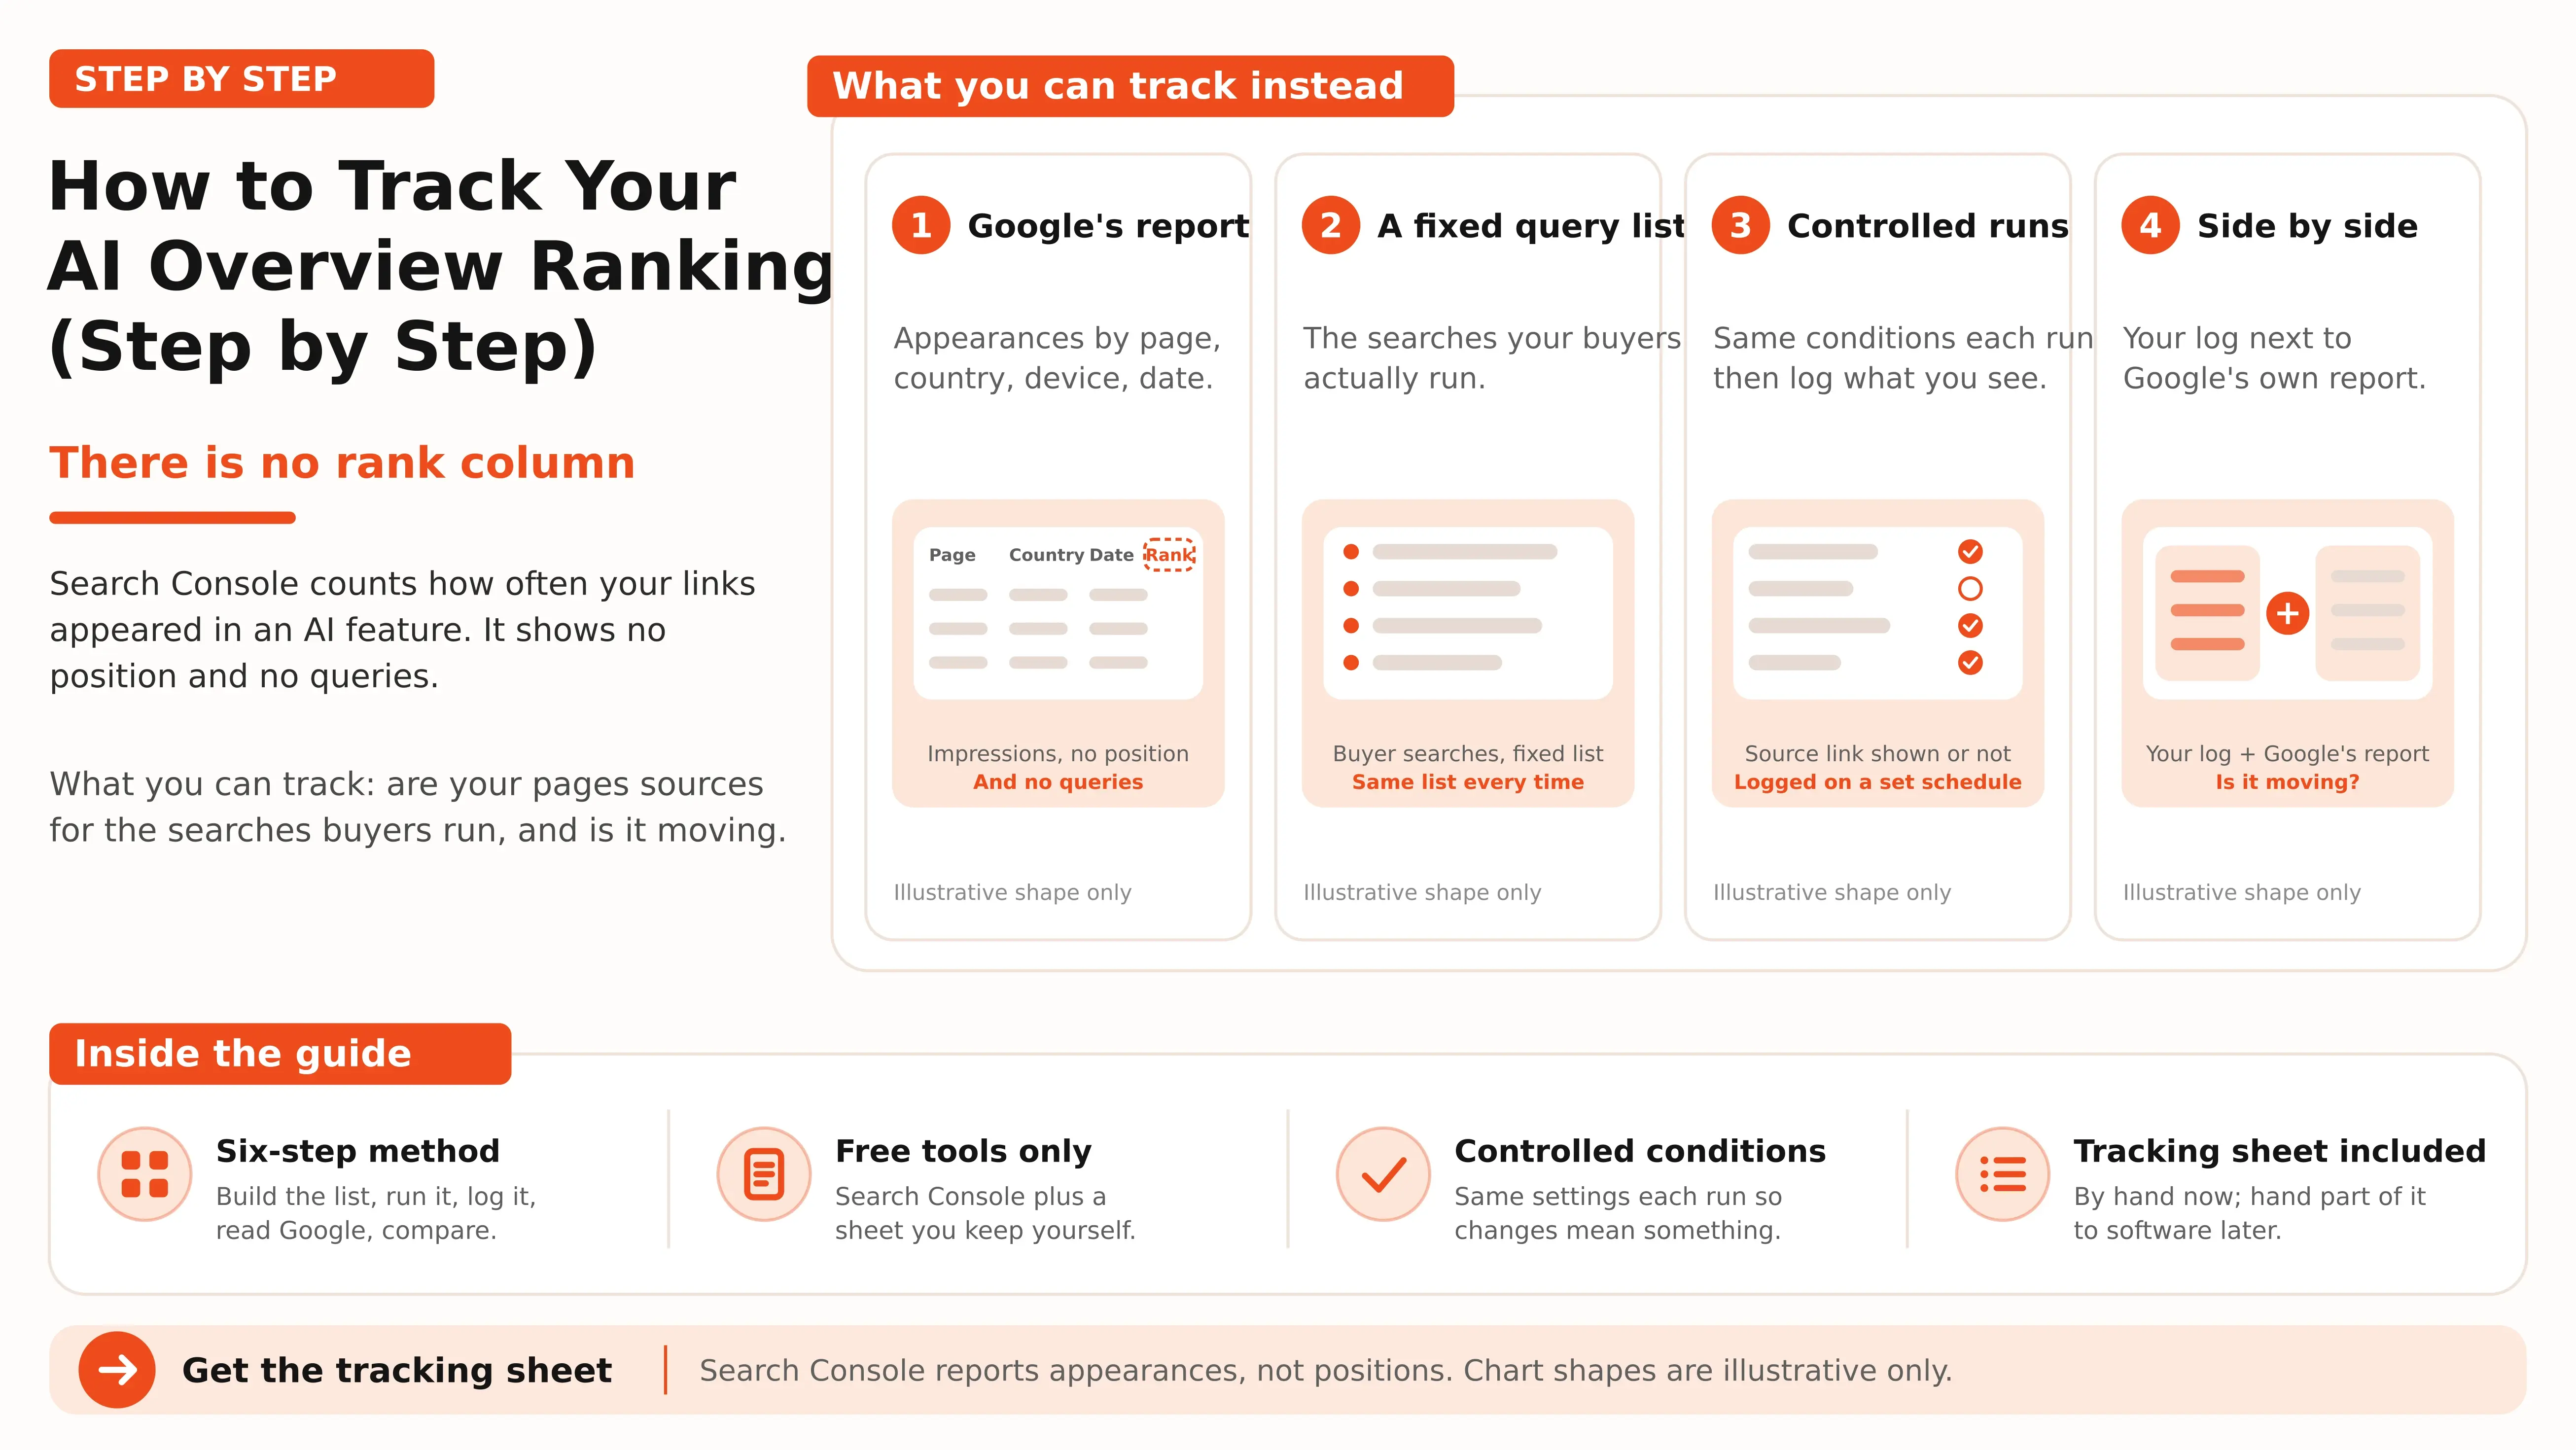


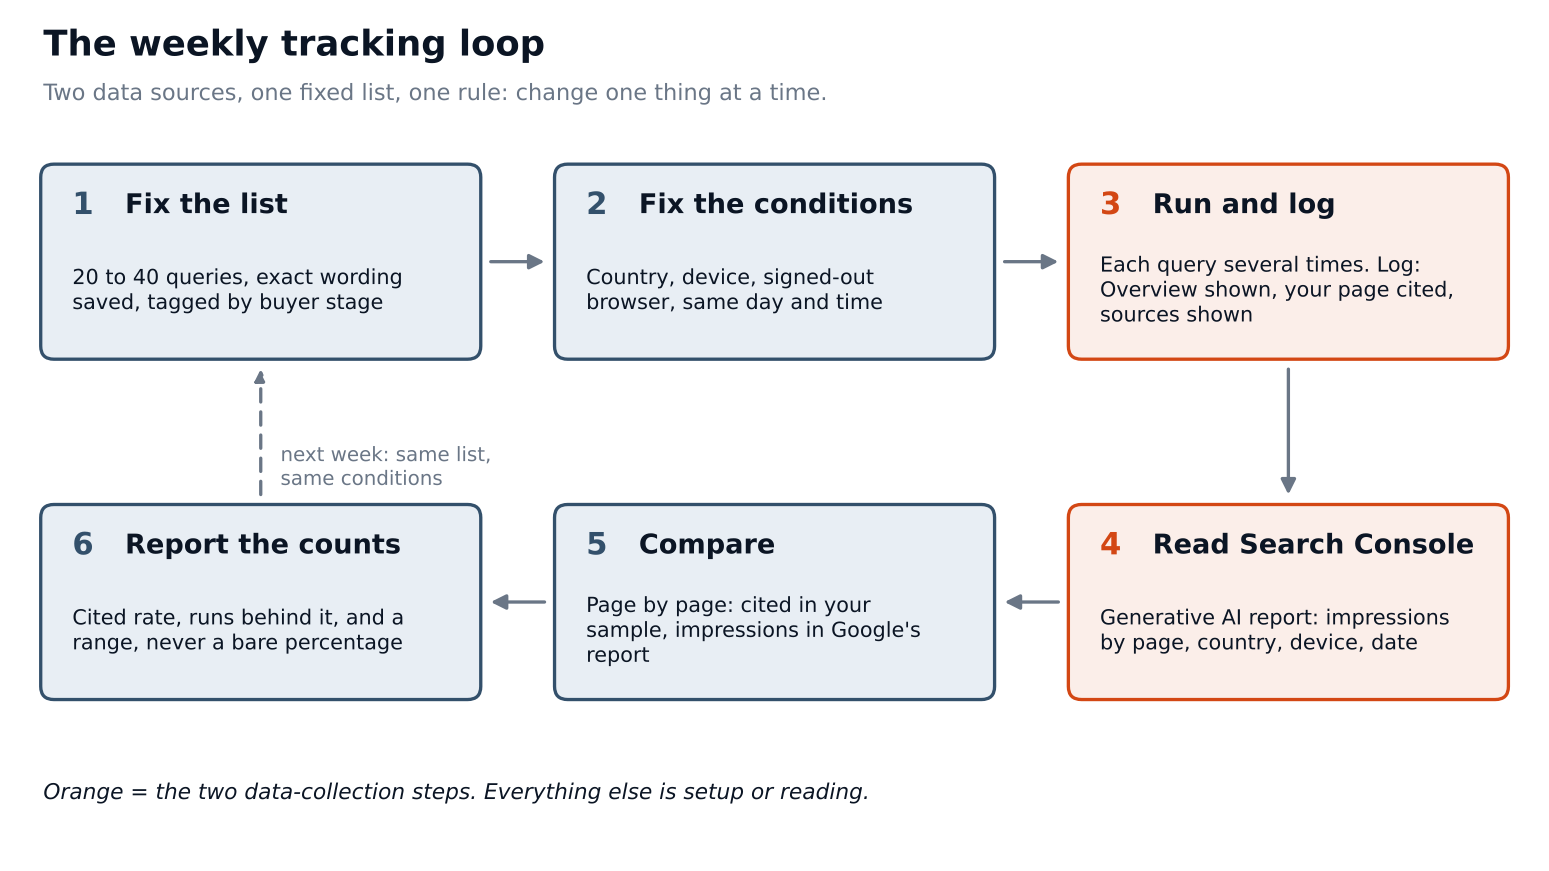
Google Search Console report shows how often your pages appear in AI features, broken down by page, country, device, and date, but not the queries behind those impressions. Unlike traditional search, AI Overviews don’t offer a single position to track. The better question is whether your pages are being cited for the searches your buyers care about, and whether that visibility is growing or fading. This guide gives you a six-step method for doing that with free tools. You will build a fixed query list, run it under controlled conditions, log what you see, read Google's own report, and put the two side by side. A tracking sheet is included, and the method works whether you do it by hand or later hand part of it to software.
What "ranking" means inside an AI Overview
Before you track anything, decide which outcome you are counting. There are three, and they are not the same.
1. Shown
An AI Overview appeared for the search at all. This is a fact about the query, not about you. If no Overview appears, there is nothing to rank in. In a Pew Research Center analysis of March 2025 browsing data from 900 US adults, about 18 percent of the 68,879 Google searches included an AI summary. That figure is dated, covers one set of users, and will differ from your queries, but the point holds: a share of your list will show no Overview on any given day, and "no Overview" is a valid result to log.
2. Cited
Your page appears among the source links attached to the Overview. This is the closest thing to a ranking you can observe. It is a yes or no per run, not a position.
3. Mentioned
Your brand name appears in the generated text, with or without a link. A brand can be mentioned and not cited, or cited and not named. Log the two separately, because they respond to different changes.
Some tools report a "position" for AI Overview links. Treat any such number as that tool's own definition, and ask what it measures before you compare it with anything. Google's report does not describe one.
What Google gives you, and what it does not
Google's Search Console now has a generative AI performance report. According to Google's Help page for it, the report covers AI Overviews and AI Mode, and as of August 31, 2026 it is available to all websites worldwide. Here is what it contains, as the Help page describes it:
- Metric: impressions, meaning how many times links to your site were shown to a user in a generative AI feature on Google Search. The page does not describe clicks, click-through rate or average position for this report.
- Dimensions: pages (the canonical URL after redirects), countries, dates (in Pacific Time) and devices. Queries are not a dimension.
- Search type filter: Web: text-based, and Web: multimodal, which covers searches that start from Lens, Circle to Search, uploaded images or Chrome image search.
- Limits: the table holds up to 1,000 rows, the newest data can be preliminary, and "~" or "-" values become zeros in exports. The report may not appear at all if your site has too few generative AI impressions.
Google's separate guidance on AI features and your website adds two points that matter for tracking. First, there are no additional technical requirements to appear as a supporting link: the page must be indexed and eligible to be shown with a snippet. Second, traffic from AI features is counted in your overall search traffic and reported under the Web search type in Search Console, so your analytics tool will not separate AI Overview visits from other Google organic visits.
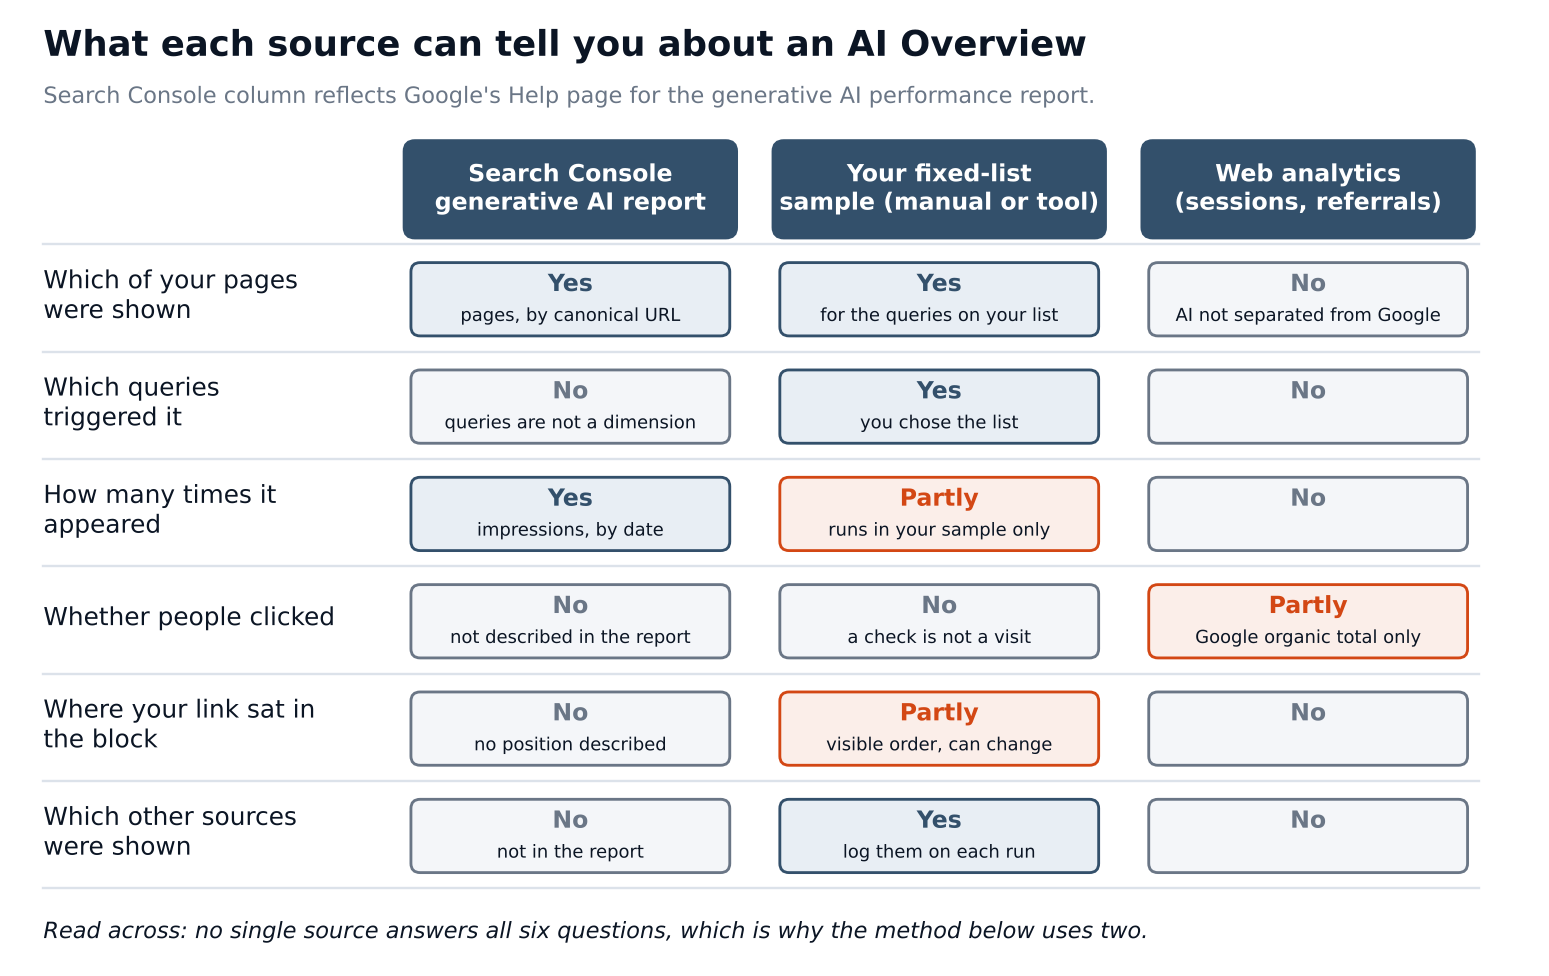
No single source answers all six questions. Search Console gives you page-level counts from Google itself, with no query detail. A sample you run yourself gives you query-level detail, with no volume. Together they cover most of what you need.
Step 1: Write the fixed query list
Start with 20 to 40 queries. Fewer than 20 and one odd result moves everything. More than 40 and a manual check becomes a chore you will skip. Pull them from three places:
- Questions buyers ask before they talk to sales. Sales call notes, support tickets and the "how do I" questions in your inbound forms. Phrase them the way a person types them, not the way your marketing team words a topic. Our buyer prompt library shows how to turn those into a reusable list.
- Queries your key pages already earn. In Search Console's regular Performance report, open the queries for your ten most important pages and add the question-style ones.
- Queries you want to win and do not yet. Keep these to about a quarter of the list, so the rest of the list reflects where you already stand.
Tag each query with a buyer stage (early question, comparison, ready to buy) and the page you hope will be cited. Save the exact wording and do not edit it later. If you change the wording, you have started a new list.
One caution: where you can, include a few long, specific queries as well as short ones. Different phrasings can surface different sources, which is why a fixed list beats ad hoc spot checks. The reason is that small changes in phrasing can change which sources get shown.
Step 2: Lock the conditions
The goal is to change only one thing between runs: time. Decide these settings once and write them in the sheet.
- Country and language. Use the market you sell in. Search Console reports by country, so this also lets you compare like with like.
- Device. Desktop or mobile, one per list. Run a second pass on the other device if your buyers use both.
- Signed-out browser. Use a clean profile or a private window, so your own history is less likely to shape what you see.
- Day and time. Pick a slot and keep it. Weekday mornings are fine; what matters is that it stays the same.
Be plain with yourself about what this does and does not achieve. It reduces the noise you control. It does not remove the noise you do not. Answers can differ between runs, even with identical settings, and our piece on model variability in AI citations explains why one run is never the answer.
Step 3: Run each query and log what you see
Run every query several times, not once. A reasonable starting point is three runs per query, spread across the week. With 30 queries that is 90 runs a week. At about a minute a run (a planning estimate, not a measured figure), that is roughly 90 minutes of work.
For each run, record:
- the date and run number
- whether an AI Overview appeared (yes or no)
- whether any of your pages appeared among the source links, and which URL
- whether your brand was named in the text
- the other sources shown, as domains
Then work out two rates, and keep the denominators visible:
- Overview rate = runs that showed an Overview, divided by all runs.
- Cited rate = runs where your page was a source, divided by the runs that showed an Overview.
Use the second denominator on purpose. If you divide by all runs, a query that never triggers an Overview drags your cited rate down for a reason that has nothing to do with your content. Log the count alongside each percentage, for example "9 of 40 runs", every time.
Step 4: Read the Search Console report
Once a week, open the generative AI report for your property and do the following:
- Set the date range to match your log, and keep in mind that dates are in Pacific Time.
- Filter to Web: text-based first. Look at Web: multimodal separately if image-led searches matter to your buyers.
- Open the Pages view and export the table. Note that the export turns "~" and "-" values into zeros, so check for those before you read a zero as "no impressions".
- Filter by country and device to match your sample conditions.
- Ignore the last day or two if the line is dotted, since the newest data can be preliminary.
Two cautions from the Help page are worth writing on the sheet. The chart aggregates by property, while the table aggregates depending on the dimension, so totals in the two can differ. And if the report is missing, it may mean your site has too few generative AI impressions to show, which is itself a reading worth recording.
Step 5: Put the two sources side by side
This is where the method pays off. Build one row per page you care about, with two columns: how often it was cited in your sample, and its impressions in Search Console for the same period. Three patterns show up, and each one points at a different action.
1. Cited in your sample, and impressions in Search Console. The two sources agree. Your page is being used. Watch it, and look at the next page.
2. Cited in your sample, few or no impressions in Search Console. Check your filters first: country, device, search type and date range. If they match, remember that your sample is small and Search Console is not. A handful of citations in 90 runs does not mean many impressions in Google's data.
3. Impressions in Search Console, never cited in your sample. Your list may not include the queries that actually bring the Overview. Search Console will not tell you the queries, so look at the page's regular Performance report queries and add the closest ones to the list. This is the most common reason a list drifts from reality.
Step 6: Report counts and ranges, not bare percentages
A cited rate of 30 percent sounds precise. Over 10 runs it is not. Three citations in 10 runs is consistent with a true rate anywhere from about 11 percent to about 60 percent, using a standard 95 percent Wilson interval (the method described by Brown, Cai and DasGupta in 2001).
More runs narrow the range, but slower than people expect. Here are two pairs of results:
| Result | Runs | Cited rate | Plausible range |
|---|---|---|---|
| 6 cited | 40 | 15% | about 7% to 29% |
| 9 cited | 40 | 23% | about 12% to 38% |
| 24 cited | 120 | 20% | about 14% to 28% |
| 36 cited | 120 | 30% | about 23% to 39% |
The ranges in each pair overlap, which means a jump from 20 to 30 percent over 120 runs each is a signal worth watching, not yet a result worth announcing. Overlapping ranges do not prove nothing changed. They tell you that you cannot yet separate a real change from sampling noise.
A monthly line that holds up looks like this: "Cited rate 24 of 120 runs (20%, range 14 to 28%) against 18 of 120 last month. Search Console impressions on tracked pages up. No change made that explains it." If you are using these numbers to justify a budget, our business case for AEO shows how to set the thresholds before the data arrives.
Two habits keep the series reliable. Change one thing at a time, such as one page update or one new section, and write down the date. And when a number moves, check the run counts before you tell anyone about it.
Where a tracker fits
Running 90 checks a week by hand is a good way to learn what your results look like. It is a poor way to keep going for a year. Software can run the same list on a schedule, at higher volume, and store each answer so you can reread it.
If you evaluate one, ask these five questions, whichever product you are looking at:
- How many times does it run each query, and can you set that number?
- Which country, device and search type does it check, and can you match yours?
- Does it store the full answer and source list, or only a summary score?
- How does it define "position", and what happens when no Overview appears?
- Can you export the raw runs, so you can calculate your own cited rate with its denominator?
A tool that cannot answer the first and fifth questions gives you a number you cannot check. The method above still applies: the tool replaces the typing, not the discipline.
FAQ
Can I see my position in an AI Overview? Not in Search Console. Google's report describes impressions by page, country, device and date. You can note the visible order of source links in your own runs, but it can change between runs, so treat it as a clue rather than a rank.
Does Search Console show which queries trigger AI Overviews for my pages? Not in the generative AI report: queries are not a dimension. That is why you keep your own query list and use the report for page-level counts.
How often should I check?
Weekly is enough for most B2B sites. Running the same list more often adds work without adding much information, because the ranges in Step 6 narrow slowly.
Do I need a paid tool?
No. The sheet and Search Console are enough to start. A tool becomes worth considering when your list outgrows what you will run by hand.
Do AI Overviews and AI Mode report together?
According to Google's Help page, the generative AI report covers both. If you need to compare them, see our guide on AI Overviews, AI Mode and Gemini.
Run your first ten checks today
You do not need the full 30 queries to start. Write ten, lock your conditions, run each one three times, and fill in the first rows of the sheet. By the end of the week you will know your Overview rate, your cited rate and the run counts behind both.
If you want a quick first reading of how AI answers mention you today, the AI Search Visibility Checker is a way to seed your list. When the manual runs start to feel like a second job, AI Search Intelligence tracks each of your prompts individually and records the citations, so the weekly loop stops depending on someone's calendar.