

Table Of Contents
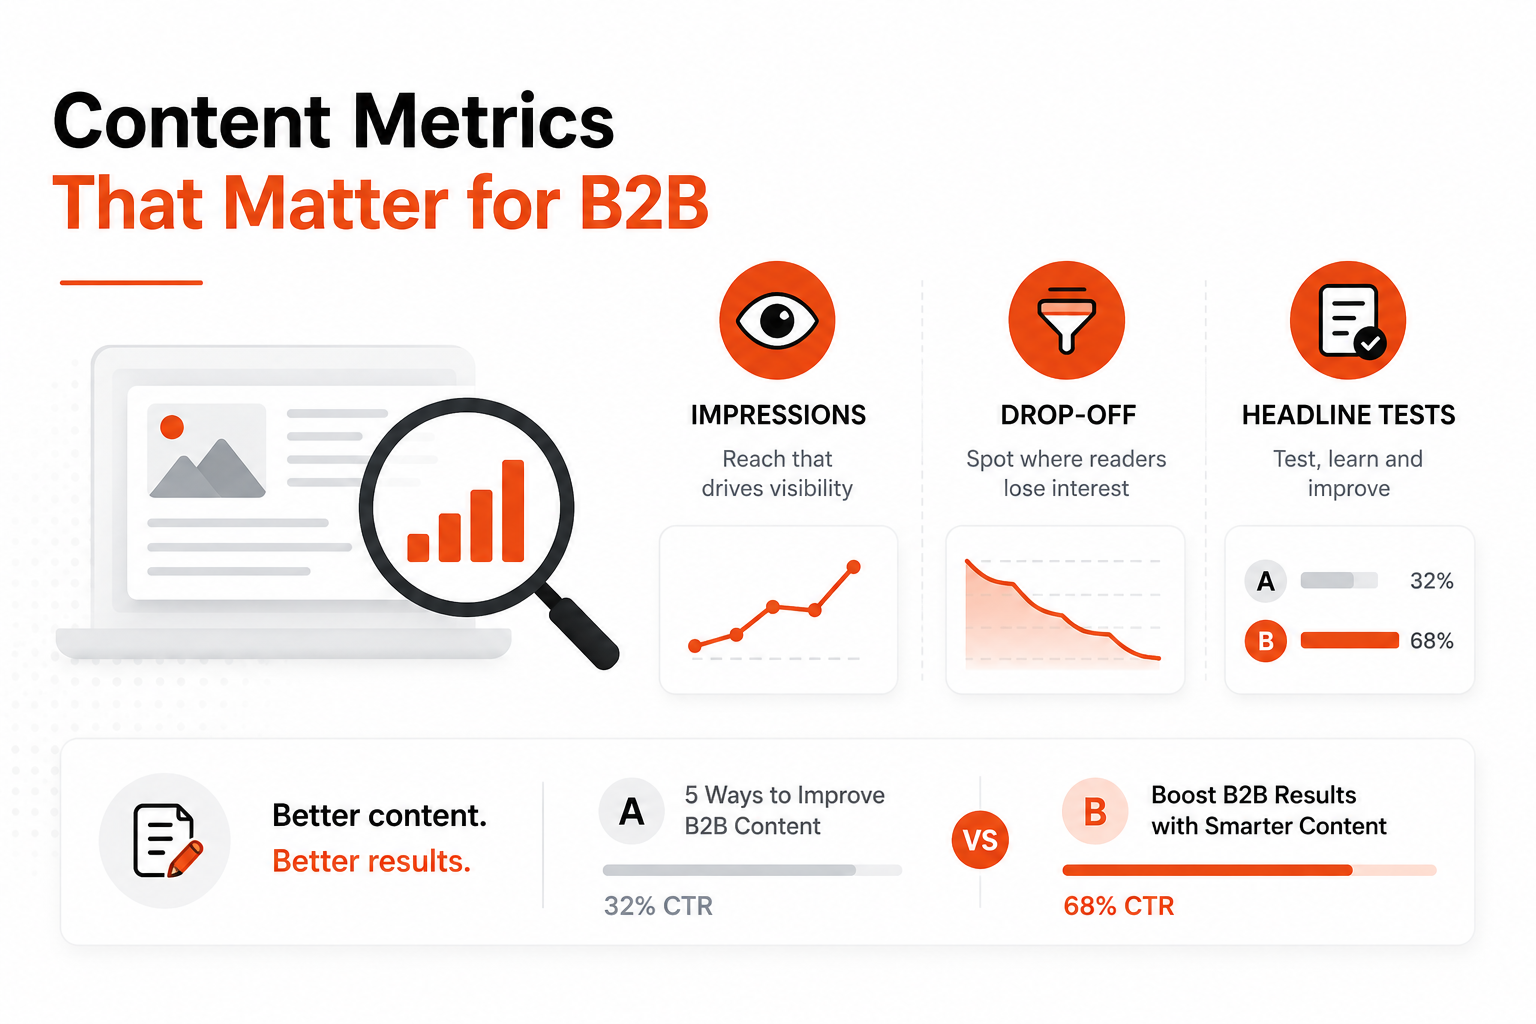
Demand‑generation leaders in mid‑market SaaS often chase likes and comments, hoping those vanity signals translate into pipeline. In reality, those surface metrics can be misleading, especially when the audience is a professional buyer who isn’t scrolling for social approval. The real story emerges when you look at raw reach, how long viewers stay engaged, and whether the headline actually moves the needle toward a qualified lead. By shifting focus to impressions, video drop‑off rates, and systematic headline testing, you surface the data that truly drives revenue. This guide shows why those three signals matter, how to capture them, and what steps you can take to turn raw data into pipeline signals.
Why Impressions Matter More Than Likes in B2B Content
Impressions represent the sheer number of potential buyers who have been exposed to a piece of content, providing a baseline of reach that likes and comments simply cannot match. For a VP of Demand Generation, knowing that a whitepaper was seen by 10,000 prospects is far more actionable than seeing 200 likes, which may be generated by bots or internal teams. Impressions also feed into broader search visibility models, helping algorithms surface your assets in zero‑click search results where buyers often find answers without clicking. According to a zero‑click search study, a high impression count can improve the likelihood of appearing in featured snippets, which directly supports buyer intent and pipeline signals.
Customers frequently note that “likes/comments are fake as we know but impressions might get us something as will reach more people, so our focus is impressions currently.” This sentiment underscores the need to treat impressions as a reliable signal of audience exposure rather than a vanity metric. When you combine impression data with intent signals such as the topics buyers are searching for you can map content to specific stages of the buyer journey. For example, a high‑impression blog post about “AI‑driven insights for revenue growth” can be linked to a topic cluster that captures search intent around AI and pipeline acceleration.
To make impressions actionable, start by tagging each asset with a unique identifier in your analytics platform, then overlay that data with buyer intent models. This lets you see which pieces are not only seen but also correlate with downstream pipeline activity. By tracking the lift in qualified leads that follows a spike in impressions, you create a feedback loop that validates content investment.
When you layer this data with Omnibound’s AI‑search growth engine, you gain a real‑time view of which prompts are driving those impressions, allowing you to fine‑tune citation‑focused content that speaks directly to the language of your prospects. The result is a more efficient allocation of creation resources and a clearer line of sight from content exposure to revenue impact.
Recommended Read: Common B2B Marketing Strategy Mistakes That Kill Pipeline - Highlights strategic pitfalls that can undermine impression‑driven campaigns.
Understanding Drop‑Off: What Video Retention Data Reveals
Video drop‑off rates expose the quality of engagement beyond a simple view count. When a viewer abandons a video within seconds, it signals that the content failed to capture attention or address the viewer’s search intent. For B2B marketers, this metric is a direct indicator of whether the messaging aligns with buyer intent and the promised value proposition.
As a video marketing manager put it, "Retention on videos is poor. 0% past 16 seconds. 4% Average percentage watched and 1-minute views just 3; out of ~222 views." Those numbers illustrate a severe engagement gap that impressions alone would hide. The underlying issue often stems from mismatched headlines or a lack of relevance to the viewer’s immediate problem. A recent B2B content trends report confirms that low retention correlates with missed opportunities to convey signal intelligence that guides the buyer forward.
Addressing drop‑off starts with segmenting viewers by source and intent signals, then testing different opening hooks. If the first 10 seconds of a video align with a high‑intent search query, you typically see higher average percentage watched. Iteratively refine the script, visual cues, and pacing based on the retention data until the 1‑minute view count climbs and the overall drop‑off curve flattens.
Beyond the opening, consider using visual markers that reinforce the buyer’s problem statement at the 15‑second mark. This practice keeps the viewer anchored to the value proposition and reduces the likelihood of early abandonment. Pairing these refinements with Omnibound’s citation‑quality dashboard helps you see which search prompts are feeding the video traffic, enabling tighter alignment between discovery and retention.
Recommended Read: B2B Content Marketing ROI: How Your Content Drives Real Revenue - Shows how to tie video performance to pipeline outcomes.
Headline Testing: Turning Titles into Pipeline Drivers
In B2B content, the headline is often the first point of contact that determines whether a prospect clicks, scrolls, or ignores an asset. A well‑crafted title can boost click‑through rates, improve search visibility, and signal relevance to AI‑driven search engines that prioritize intent signals. When a headline resonates with buyer intent, it can also enhance topic clusters, making the content more discoverable across the buyer’s research journey.
Implement a headline testing framework that includes hypothesis definition, random split traffic, and statistical significance checks. Track each variant’s impression count, click‑through rate, and the resulting qualified leads. Over time, the data will reveal which phrasing consistently drives higher buyer intent, allowing you to refine your topic clusters and improve overall search visibility.
When you feed the winning headline data back into Omnibound’s AI engine, the platform can automatically surface the most effective phrasing for future content drafts, accelerating the testing loop and ensuring that each new asset starts with a headline that is already proven to attract high‑intent traffic.
Recommended Read: AI Content Gap Analysis Tools: 10 Ways to Find Missed Opportunities - Explores how to identify content gaps that headline testing can fill.
Linking Content Metrics to Revenue Impact
Connecting impressions, drop‑off, and headline performance to actual revenue requires a clear attribution model. Without mapping content interactions to pipeline stages, you cannot prove that a high‑impression blog post or a low‑drop‑off video is influencing buyer intent or closing deals. The goal is to translate raw data into pipeline signals that executives can act upon.
Many teams struggle with “We’re seeing users engage early but then dropping off, and we don’t know why.” By integrating content intelligence platforms with CRM data, you can trace which assets contributed to a qualified lead or an opportunity. When you overlay signal intelligence such as search intent keywords that led a prospect to your site with conversion events, you create a closed‑loop view of content effectiveness.
Start by defining key milestones: first‑touch impression, video completion, and form submission after a headline click. Assign credit to each touch based on its position in the buyer journey, then calculate the contribution to pipeline revenue. This approach not only validates content spend but also informs future content planning, ensuring you focus on assets that move the needle.
Omnibound’s built‑in tracking dashboard simplifies this process by automatically attributing citation quality and share of voice to each content piece, then correlating those signals with CRM‑tracked opportunities. The result is a transparent, data‑driven narrative that links every piece of content back to the revenue line.
Practical Steps to Build a Metric‑First Content Strategy
Transitioning to a data‑first mindset involves establishing a repeatable workflow that captures impressions, monitors drop‑off, and validates headlines before scaling. The process should be anchored in clear ownership, regular reporting, and continuous optimization based on the metrics you collect.
Below is a concise framework that maps each metric to an actionable step. Use the table to align responsibilities and expected outcomes.
| Metric | What It Measures | Typical Action |
|---|---|---|
| Impressions | Raw reach and exposure | Optimize distribution channels; align with search intent keywords |
| Drop‑Off Rate | Engagement depth in video | Refine opening hook; test alternative scripts |
| Headline CTR | Title effectiveness | Run A/B tests; iterate based on click‑through data |
These three rows capture the core data points you need to monitor. By regularly reviewing the table, you ensure that every piece of content is evaluated against a consistent set of criteria.
Implement a weekly cadence where the demand‑generation team reviews the metrics, flags underperforming assets, and initiates experiments. Use the insights to feed back into your topic clusters, improve search visibility, and enhance buyer intent alignment. Over time, the cumulative effect of these disciplined actions will surface strong pipeline signals and justify content investment.
In addition, document each experiment’s hypothesis, results, and next steps in a shared repository. This knowledge base becomes a living playbook that new team members can reference, accelerating adoption of the metric‑first approach across the organization.
Integrating AI‑Driven Search Signals into Your Content Workflow
While the core metrics provide a solid foundation, the true differentiator for B2B marketers today is the ability to surface the exact prompts buyers use in AI‑driven answer engines. By feeding those prompts into the content creation process, you ensure that every headline, video hook, and supporting paragraph speaks directly to the language of the market.
This alignment not only boosts impressions but also improves the relevance score that AI search models use to rank citations.
Operationally, the workflow looks like this: first, capture buyer‑derived prompts from sales calls, support tickets, and market research; second, feed the prompts into Omnibound’s citation engine to identify gaps; third, create or update assets that directly answer those prompts; fourth, monitor the three core metrics to validate performance. The loop repeats continuously, creating a compounding effect where each iteration strengthens both visibility and pipeline contribution.
FAQs
1. How can I differentiate between genuine engagement and vanity metrics?
Focus on metrics that tie directly to buyer intent, such as impressions, video completion rates, and headline click‑throughs. Likes and comments often reflect internal activity or bots, whereas impressions show the breadth of reach and can be linked to search visibility. By mapping these signals to downstream lead generation, you create a clear line of sight from content to pipeline.
2. What tools can help me capture video drop‑off data without manual spreadsheets?
Many video platforms provide built‑in retention analytics that break down viewership by time intervals. Look for solutions that export retention curves automatically and integrate with your analytics stack. This eliminates the need for manual data extraction and lets you focus on optimizing the first 15 seconds, where most drop‑off occurs.
3. How often should I run headline A/B tests?
Run headline tests whenever you publish a high‑impact asset or notice a plateau in click‑through rates. A typical cadence is to test new variations every 2‑4 weeks, allowing enough traffic to reach statistical significance while keeping the content fresh for search intent queries.
4. Can impression data alone prove ROI?
No. Impressions provide the exposure baseline, but you need to layer them with downstream actions such as form submissions, demo requests, or pipeline movement to calculate true ROI. Combining impression data with intent signals and conversion events creates a complete picture of content performance.
Conclusion
For B2B marketers, the path from content creation to pipeline growth hinges on three core metrics: impressions, video drop‑off rates, and headline performance. By treating these signals as the foundation of your measurement framework, you move beyond vanity metrics and gain a data‑first view of what truly drives revenue. Apply the practical steps outlined above, align your content with buyer intent, and let the metrics guide your optimization cycle. When you let impressions, retention, and headline testing speak, you empower your team to make informed decisions that translate directly into pipeline impact.
Recommended Authority Resources
- Reference: In 2026, Less than One Third of Google Searches Still ... - Provides the latest zero‑click search statistics that illustrate the importance of impression volume for AI‑driven search visibility.
- Reference: Google zero‑click searches reach 68% in early 2026: Study - Offers detailed data on how zero‑click search trends affect content discoverability.
- Reference: B2B Content and Marketing Trends: Insights for 2026 - Highlights industry benchmarks for video engagement and content performance.
Turn Your Content Into AI-Search Winners
Get cited across ChatGPT, Claude & Perplexity — not just ranked on Google.
- Increase AI citations
- Improve answer visibility
- Track brand mentions in LLMs