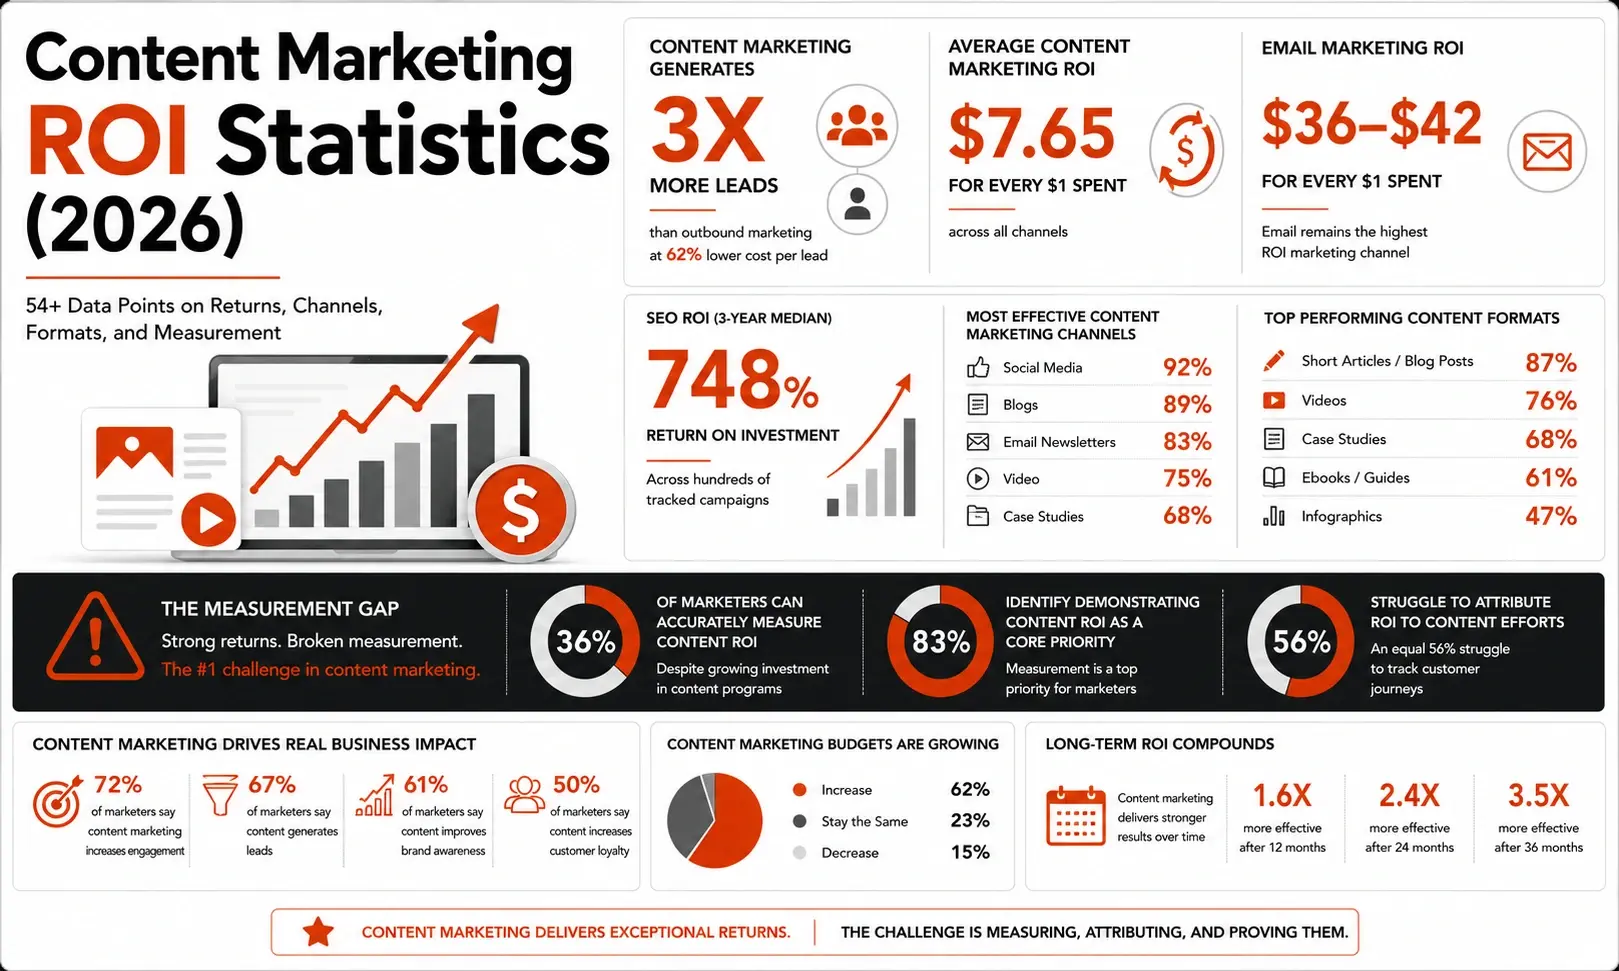


Content marketing generates 3x more leads than outbound marketing at 62% lower cost per lead (Demand Metric / Content Marketing Institute). That benchmark, first established by Demand Metric and replicated across HubSpot, CMI, and DemandSage data through 2025–2026, remains the most-cited and most consistently validated statistic in the field. The average content marketing program returns $7.65 for every $1 spent across all channels (SQ Magazine, 2025 analysis). Email marketing alone returns $36–$42 for every $1 (Litmus, State of Email 2025); median SEO ROI across hundreds of tracked campaigns is 748% over three years (First Page Sage, 2026).
The commercial case has never been stronger. Yet a structural problem runs parallel to the strong returns: only 36% of marketers can accurately measure content ROI despite 83% identifying its demonstration as a core priority (Genesys Growth, Content Marketing ROI Statistics 2026). The CMI's 2025 B2B research (n=1,015 B2B marketers) found that 56% struggle to attribute ROI to content efforts and an equal 56% struggle to track customer journeys (CMI, B2B Content Marketing: Insights for 2026). Extraordinary returns and broken measurement infrastructure are operating simultaneously, and that gap defines the content marketing challenge in 2026.
We aggregated data from the Content Marketing Institute, HubSpot, Wyzowl, Litmus, Omnisend, Demand Metric, First Page Sage, BrightEdge, and Orbit Media to compile the most rigorously sourced content marketing ROI statistics available for 2026.
Key Takeaways
- Content marketing generates 3x more leads than outbound at 62% lower cost (Demand Metric / CMI)
- Average content marketing ROI: $7.65 for every $1 spent (SQ Magazine, 2025)
- Email marketing ROI: $36–$42 per $1 spent, the highest-returning digital channel (Litmus, State of Email 2025)
- Median SEO ROI: 748% over 3 years, B2B SaaS averages 702%, breaking even at month 7 (First Page Sage, 2026)
- Top 3 ROI-driving content formats are all video: short-form (49%), long-form video (29%), live-streaming (25%) (HubSpot, State of Marketing 2026)
- 82% of marketers say video marketing delivers good ROI; 91% of businesses use video as a marketing tool (Wyzowl, Video Marketing Statistics 2026)
- Companies with a documented content strategy are 3.5x more successful than those without one (CMI, B2B Content Marketing: Insights for 2026)
- 82% of marketers actively invest in content marketing, up 12% from 2024 (HubSpot, State of Marketing 2026)
- 56% of B2B marketers struggle to attribute ROI to content efforts; only 36% can accurately measure it (CMI, 2025; Genesys Growth, 2026)
- B2B SaaS content marketing averages 844% ROI over 3 years (Averi.ai benchmarks, 2026, citing CMI data)
- Organic search drives 53% of all trackable website traffic, more than any other single channel (BrightEdge, 2025)
- Automated emails generate 320% more revenue than non-automated campaigns, representing 77% of total email ROI (Litmus / Omnisend)
The Core ROI Case: Why Content Marketing Returns What It Does
Content marketing's ROI advantage over paid advertising and outbound is structural, not accidental. Unlike paid channels that require continuous spend to maintain visibility, content assets compound over time: a well-ranked blog post generates traffic for years with no incremental cost per visit, email lists grow in value, and video libraries continue converting. The 3x lead generation / 62% lower cost benchmark from Demand Metric captures the long-run economic reality, once content infrastructure is in place, the marginal cost of each additional lead falls while paid channels maintain constant cost.
The global content marketing market itself reflects the commercial validation: revenue reached $107.5 billion in 2026 and is projected to approach $2 trillion by 2032. Companies are investing at these levels because the returns justify it, 82% now actively invest in content marketing, up 12% from 2024.

| Metric | Value | Source |
|---|---|---|
| Lead generation vs. outbound marketing | 3x more leads | Demand Metric / CMI |
| Cost vs. outbound marketing | 62% lower cost per lead | Demand Metric / CMI |
| Average ROI across content marketing channels | $7.65 per $1 spent | SQ Magazine, 2025 analysis |
| Marketers actively investing in content marketing | 82% (up 12% from 2024) | HubSpot, State of Marketing 2026 |
| Content marketers who say content generates demand and leads | 87% | CMI, B2B Content Marketing: Insights for 2026 |
| Average cost per lead: content marketing vs. paid advertising | $47 content vs. $121 paid | HubSpot / Kapost benchmark |
| Organic search close rate vs. outbound | 14.6% organic vs. 1.7% outbound | Search Engine Land, sourced via HubSpot |
| Global content marketing market revenue (2026) | $107.5 billion | Statista, 2025 |
The organic lead close rate differential, 14.6% for organic versus 1.7% for outbound, is the most powerful argument for content's ROI advantage. The same lead volume from organic content closes at nearly 9x the rate of cold outbound. That differential means content programs require roughly one-ninth the lead volume to produce equivalent revenue, a multiplier that becomes dramatic at scale.
ROI by Channel: Email, SEO, Video, and Paid Media Compared
Not all content marketing channels return equally. The ROI hierarchy is clear and consistent across multiple primary studies. Email delivers the highest average return ($36–$42 per $1), followed by SEO content (748% median 3-year ROI), video (82–93% of marketers report good ROI), and organic social (where only 30% say they can accurately measure ROI). Paid advertising closes out the comparison at roughly $2 per $1, making it the most measurable but least efficient content investment.
HubSpot's 2026 State of Marketing finds that website, blog, and SEO content is the #1 ROI-generating channel (cited by 27% of marketers), followed by paid social (26%) and email (22%). The sequencing reflects channel maturity and measurement confidence as much as actual return, email's ROI dominance partly reflects its superior attribution infrastructure.

| Channel | ROI Benchmark | Source |
|---|---|---|
| Email marketing | $36–$42 per $1 (3,600–4,200%) | Litmus, State of Email 2025 |
| Email marketing (top performers) | Up to $79 per $1 (Omnisend merchants 2025) | Omnisend internal data, 2025 |
| SEO / content (median 3-year ROI) | 748% | First Page Sage, 2021–2025 campaign data |
| SEO vs. PPC (return per $1) | SEO $7.48 vs. PPC $2.00 | NP Digital / First Page Sage, 2026 |
| Organic search: share of all trackable website traffic | 53% | BrightEdge, 2025 |
| Video marketing: marketers reporting good ROI | 82% | Wyzowl, Video Marketing Statistics 2026 |
| Paid advertising average ROI | $2 per $1 | WordStream, 2026 |
| Social media ROI: marketers who can accurately measure it | Only 30% | Sprout Social Index, 2025 |
| #1 ROI-generating channel (marketers cited) | Website, blog, and SEO (27%) | HubSpot, State of Marketing 2026 |
The gap between email ($36–$42 per $1) and paid advertising ($2 per $1) represents a 18–21x ROI differential between the highest and lowest returning channels. The question for most content programs is not whether to invest, it is how to allocate across these channels to maximize the compounding advantage of owned and earned media over paid.
Blog and SEO Content ROI
SEO-driven blog content is the longest-duration ROI generator in the content marketing stack. First Page Sage's analysis of hundreds of client campaigns (2021–2025) finds the median SEO ROI at 748% over three years, with B2B SaaS specifically returning 702% and breaking even at month 7. The compounding nature of SEO is captured in a single benchmark: a well-ranked blog post generates 60% more traffic in months 7–12 than it did in months 1–6, returns that continue indefinitely at near-zero marginal cost.
Blog volume matters too: companies that publish 16+ blog posts per month generate 3.5x more traffic and 4.5x more leads than those publishing 0–4 posts per month (HubSpot). Companies with active blogs generate 67% more leads monthly than those without.

| Metric | Value | Source |
|---|---|---|
| Median SEO ROI (3-year) | 748% | First Page Sage, 2021–2025 campaign data |
| B2B SaaS content marketing ROI (3-year) | 702–844% | First Page Sage / Averi.ai / CMI data, 2026 |
| SEO break-even timeline (B2B SaaS) | Month 7 on average | First Page Sage, 2026 |
| Blog post traffic growth: months 7–12 vs. months 1–6 | +60% more traffic | Neil Patel analysis, 2025 |
| Organic traffic share of all website traffic | 53% | BrightEdge, 2025 |
| Companies with active blogs: monthly lead generation vs. those without | +67% more leads | HubSpot, 2025 |
| Blog-prioritizing marketers: likelihood of positive ROI | 13x more likely | HubSpot, 2025 |
| Websites with regularly updated blogs: indexed pages vs. static sites | 430% more indexed pages | Taboola / HubSpot data, 2026 |
The 430% indexed pages advantage for blogging sites reflects Google's crawl prioritization for frequently updated content. More indexed pages means more organic entry points, each post is a potential ranking for a different search query. At scale, a 200-post blog library is equivalent to 200 independent organic lead generation assets, each working independently and indefinitely.
Omnibound's Create Citation-Worthy Content helps content teams build the type of original, research-backed content that earns both organic search rankings and AI citations, compounding returns across traditional and AI-first search simultaneously.
Video Content ROI
Video has moved from a content format to the content format. HubSpot's 2026 State of Marketing names short-form video the #1 ROI-driving format (cited by 49% of marketers), making all three top ROI formats video-based (short-form 49%, long-form 29%, live-streaming 25%). Wyzowl's annual survey of video marketers found 82% report good ROI in 2026, down slightly from 93% the prior year as more first-time adopters enter the dataset, but still an overwhelmingly positive majority.
The format-level data is precise: videos under 60 seconds generate 2.5x more engagement per impression than any other content type. The optimal length for ROI is 30 seconds to 2 minutes, cited by 71% of marketers as most effective, with engagement rates for sub-1-minute videos at 50% compared to 17% for videos over 60 minutes.

| Metric | Value | Source |
|---|---|---|
| #1 ROI-driving content format | Short-form video (49% of marketers) | HubSpot, State of Marketing 2026 |
| Top 3 ROI-driving formats (all video) | Short-form 49%, long-form 29%, live-streaming 25% | HubSpot, State of Marketing 2026 |
| Video marketers reporting good ROI | 82% (Wyzowl 2026) | Wyzowl, Video Marketing Statistics 2026 |
| Businesses using video as a marketing tool | 91% | Wyzowl, Video Marketing Statistics 2026 |
| Video increased direct sales (marketers) | 84% | Wyzowl, Video Marketing Statistics 2025 |
| Video that helped generate leads | 88% of video marketers | Wyzowl, Video Marketing Statistics 2025 |
| Optimal video length for ROI | 30 seconds to 2 minutes (71% of marketers) | Wyzowl, Video Marketing Statistics 2026 |
| Engagement rate: videos under 1 minute | 50% (vs. 17% for videos over 60 minutes) | Wistia platform data, 2025 |
The 84% of video marketers who say video directly increased their sales is one of the most commercially direct ROI findings in the dataset. Unlike SEO content (which drives awareness and consideration), video is demonstrably closing deals, particularly at the consideration and decision stages where product demos, customer testimonials, and how-to videos accelerate buyer confidence.
Content Strategy as ROI Multiplier
The most significant performance gap in content marketing is not between formats or channels, it is between organizations with a documented content strategy and those without one. CMI's 2026 data finds companies with documented strategies are 3.5x more successful than those without. Marketers with documented strategies are 4x more likely to report success.
The strategy gap is narrowing but significant: 73% of B2B and 70% of B2C marketers now have a documented content marketing strategy, up from about 40% in 2018. But documentation alone does not guarantee results, only 29% of those with documented strategies rate them as extremely or very effective, with 42% of the rest attributing poor performance to a lack of clear goals.

| Metric | Value | Source |
|---|---|---|
| Companies with documented strategy vs. those without: success rate | 3.5x more successful | CMI, B2B Content Marketing: Insights for 2026 |
| B2B marketers with documented content strategy | 73% | CMI / Digital Applied, 2026 |
| B2C marketers with documented content strategy | 70% | CMI / Digital Applied, 2026 |
| Top performers who attribute success to audience understanding | 82% | CMI, B2B Content Marketing: Insights for 2026 |
| Content marketers who effectively measure content performance | 51% | CMI, B2B Content Marketing: Benchmarks 2025 |
| B2B marketers: "extremely or very successful" with content | 22% | CMI, B2B Content Marketing: Benchmarks 2025 |
| AI-augmented content programs: reported ROI increase | 68% | Semrush, 2024 |
| B2B marketers planning to increase marketing spend in 2026 | 61% | CMI, B2B Content Marketing: Insights for 2026 |
The 22% "extremely or very successful" figure from CMI is a striking reminder that strong industry-level ROI data masks a long tail of underperforming programs. The average content marketing ROI is positive. The median program is not delivering it. The gap between top performers (who are 37x more likely to rate their strategy as effective) and the majority reflects execution quality, specifically strategy documentation, goal clarity, and measurement infrastructure, not channel access.
The Measurement Gap: Content Marketing's Structural Problem
The single most consequential finding in content marketing ROI research is also the most neglected: only 36% of marketers can accurately measure content ROI despite 83% identifying its demonstration as a core priority. CMI's enterprise research (n=310) puts the measurement failure in stark operational terms: 63% of enterprise marketers struggle to attribute ROI to content efforts, and 66% face difficulty tracking customer journeys across touchpoints.
This creates a dangerous illusion: content programs appear to be underperforming when they are often working, the problem is attribution, not impact. When a buyer reads three blog posts, watches a demo video, opens four emails, and then clicks a Google ad before converting, last-click attribution assigns 100% of the revenue to the ad. The content program that built the relationship is invisible in the data.

| Metric | Value | Source |
|---|---|---|
| Marketers who can accurately measure content ROI | Only 36% | Genesys Growth, Content Marketing ROI Statistics 2026 |
| Marketers who prioritize ROI demonstration | 83% | Genesys Growth, 2026 |
| B2B marketers struggling to attribute ROI to content | 56% | CMI, B2B Content Marketing: Benchmarks 2025 |
| Enterprise marketers struggling with content attribution | 63% | CMI, Enterprise Content Marketing Research 2025 |
| Enterprise marketers struggling to track customer journeys | 66% | CMI, Enterprise Content Marketing Research 2025 |
| B2B marketers who rate their measurement as highly effective | 22% | CMI, B2B Content Marketing: Benchmarks 2025 |
| Marketers struggling with multi-channel attribution | 47% | Genesys Growth, 2026 |
The measurement problem is now compounded by a new challenge: AI search. As buyers increasingly research through ChatGPT, Perplexity, and Google AI Mode, generating no web analytics signals, the gap between actual content influence and measured content attribution is widening further. Content that shapes a buyer's vendor shortlist through an AI conversation will never appear in your Google Analytics referral data. Teams that optimize for measurement convenience rather than actual buyer influence will systematically undervalue their content programs.
Omnibound's AI Search Intelligence tracks where your content earns AI citations, bridging the measurement gap between content investment and AI-mediated buyer influence that traditional analytics cannot capture.
Omnibound's Create Citation-Worthy Content builds content specifically structured to earn citations in AI-generated answers, converting the invisible AI influence channel into a measurable asset.
Content Marketing ROI by the Numbers
| Metric | Value | Source |
|---|---|---|
| Content marketing: leads vs. outbound | 3x more | Demand Metric / CMI |
| Content marketing: cost vs. outbound | 62% lower | Demand Metric / CMI |
| Average content marketing ROI | $7.65 per $1 | SQ Magazine, 2025 |
| Marketers actively investing in content marketing | 82% | HubSpot SOM 2026 |
| Content generates demand and leads | 87% of marketers | CMI B2B 2026 |
| Average CPL: content vs. paid | $47 vs. $121 | HubSpot / Kapost |
| Organic lead close rate vs. outbound | 14.6% vs. 1.7% | Search Engine Land / HubSpot |
| Global content marketing market (2026) | $107.5 billion | Statista 2025 |
| Email ROI | $36–$42 per $1 | Litmus State of Email 2025 |
| Email ROI: top performers | Up to $79 per $1 | Omnisend data, 2025 |
| Automated emails: share of email revenue | 77% | Litmus / Omnisend |
| Automated emails: revenue vs. non-automated | 320% more | Litmus / Omnisend |
| Median SEO ROI (3-year) | 748% | First Page Sage 2026 |
| B2B SaaS content ROI (3-year) | 702–844% | First Page Sage / Averi.ai 2026 |
| SEO break-even: B2B SaaS | Month 7 | First Page Sage 2026 |
| Organic traffic share of all website traffic | 53% | BrightEdge 2025 |
| Blogs: monthly leads vs. companies without | +67% more | HubSpot 2025 |
| Blog-prioritizing marketers: positive ROI likelihood | 13x more likely | HubSpot 2025 |
| #1 ROI-driving content format | Short-form video (49%) | HubSpot SOM 2026 |
| Video marketers reporting good ROI | 82% | Wyzowl 2026 |
| Businesses using video as marketing tool | 91% | Wyzowl 2026 |
| Video directly increased sales | 84% | Wyzowl 2025 |
| Documented strategy: success rate vs. without | 3.5x more successful | CMI 2026 |
| B2B marketers with documented strategy | 73% | CMI / Digital Applied 2026 |
| AI-augmented content: reported ROI increase | 68% | Semrush 2024 |
| Marketers who can accurately measure content ROI | Only 36% | Genesys Growth 2026 |
| B2B marketers struggling with content attribution | 56% | CMI Benchmarks 2025 |
| Enterprise: struggle to track customer journeys | 66% | CMI Enterprise Research 2025 |
| Marketers struggling with multi-channel attribution | 47% | Genesys Growth 2026 |
Methodology and Sources
This article was compiled from primary research organizations and named industry studies published between 2024 and 2026. Every statistic was traced to its originating study before inclusion. Secondary aggregators were used only to locate primary sources.
Primary sources (Tier 1):
- Content Marketing Institute (CMI), B2B Content Marketing Benchmarks, Budgets & Trends: Outlook for 2025 (n=980 B2B marketers, June–August 2024); B2B Content Marketing: Insights for 2026 (n=1,015 B2B marketers, June–August 2025); Enterprise Content Marketing Research 2025 (n=310 enterprise marketers, companies with 1,000+ employees)
- HubSpot, State of Marketing Report 2026 (n=1,500+ global marketers); Marketing Statistics 2026 (aggregated from multiple HubSpot primary studies)
- Wyzowl, Video Marketing Statistics 2026 (annual survey; marketers worldwide)
- Litmus, State of Email 2025 (n=2,000+ marketing professionals worldwide; email ROI benchmarks by strategy and team size)
- Omnisend, Email marketing ROI data 2025 (internal merchant platform data; 10,000+ merchants)
- Demand Metric / Content Marketing Institute, Content Marketing Infographic (3x leads, 62% lower cost benchmark; most-cited primary source for content vs. outbound economics)
- First Page Sage, The ROI of SEO (Q1 2021–Q3 2025 proprietary campaign data across hundreds of client engagements; 748% median ROI)
- BrightEdge, Channel Performance Report (organic traffic share analysis; 53% of trackable website traffic)
- Orbit Media, Annual Blogging Survey 2025 (blogger self-reported performance and time data)
Recency notes:
- The Demand Metric "3x leads, 62% lower cost" benchmark originated from a study published circa 2013–2014. It has been replicated and cited consistently by HubSpot, CMI, and DemandSage through 2025–2026. No newer primary study has contradicted this directional finding, and it is labeled throughout as the most-cited primary benchmark rather than a recent study.
- All other statistics in this article are from 2024–2026 primary research.
Last updated: June 2026. We review and update this page quarterly as new primary research is published.


%2054+%20Data%20Points%20on%20Measurement%20Gaps%2c%20Model%20Adoption%2c%20and%20ROI%20Impact.webp?height=245&name=Marketing%20Attribution%20Statistics%20(2026)%2054+%20Data%20Points%20on%20Measurement%20Gaps%2c%20Model%20Adoption%2c%20and%20ROI%20Impact.webp)