


Last updated: April 2026 We update this page quarterly. If you identify a stat that has been superseded by newer primary research, contact us and we will review and update accordingly.
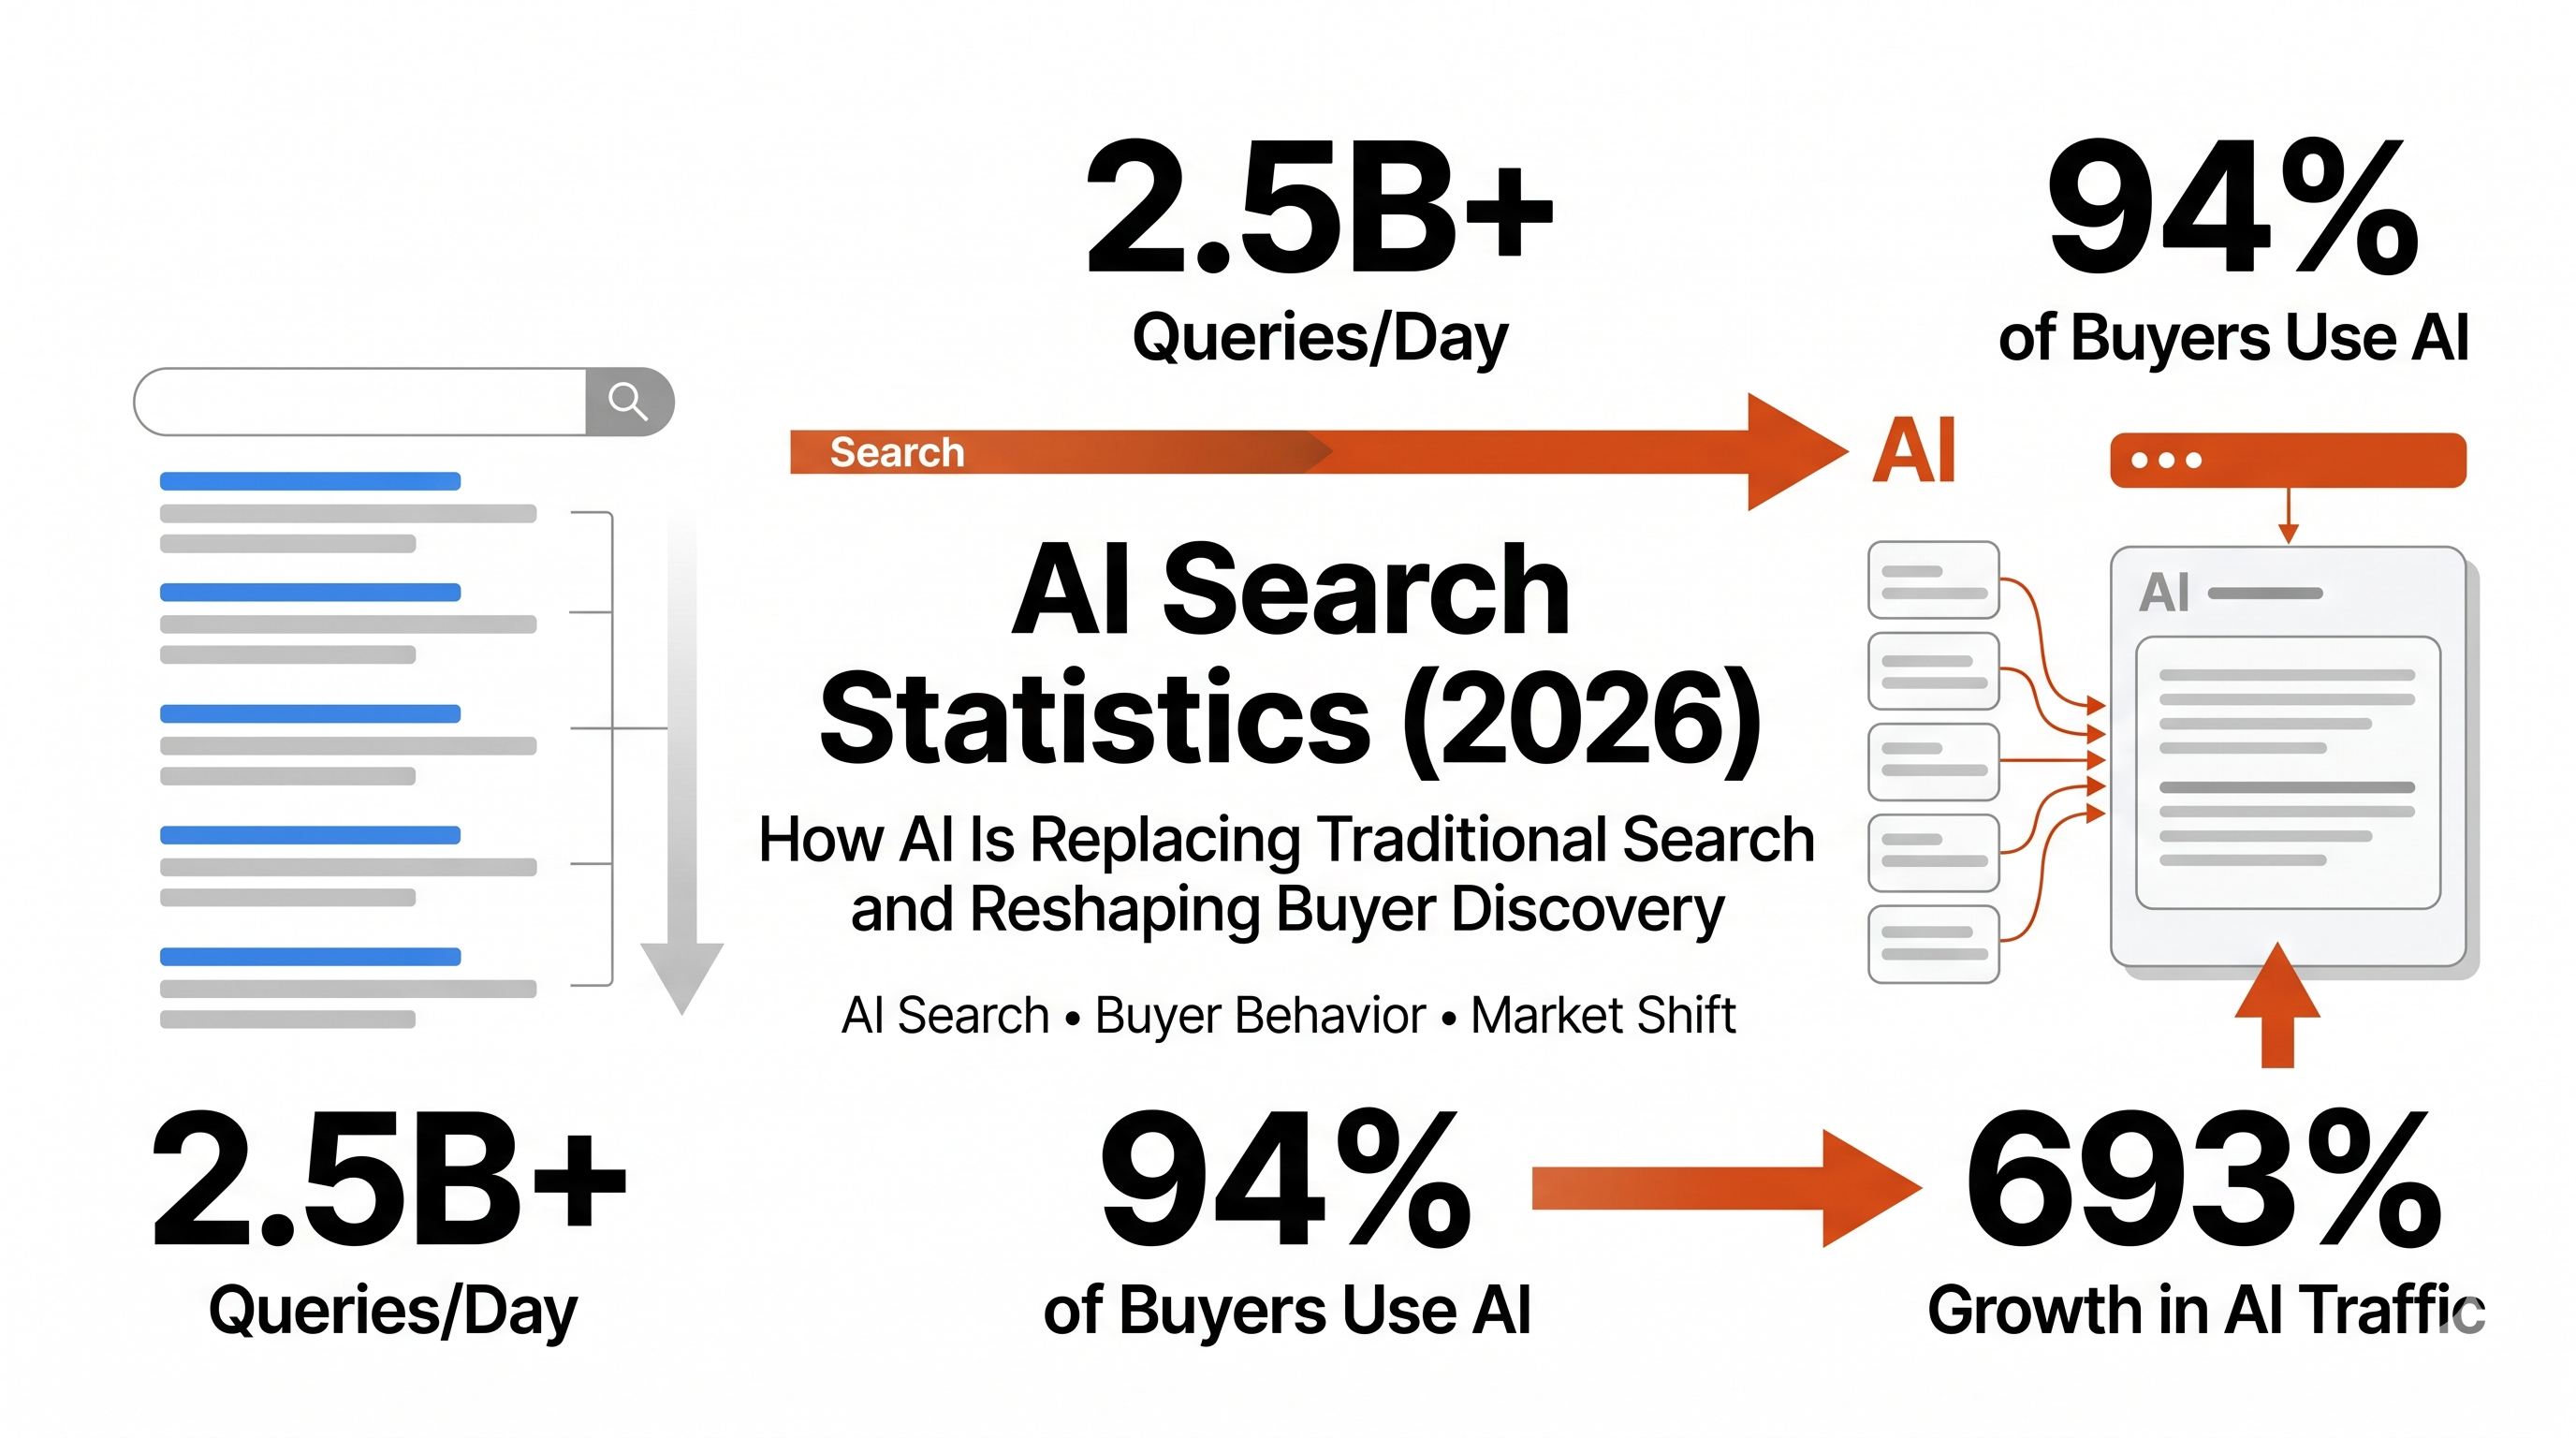
ChatGPT alone now processes 2.5 billion queries per day — and 94% of B2B buyers used a generative AI tool during their most recent purchase process (OpenAI, July 2025; 6sense, 2025 Buyer Experience Report). By the end of 2025, global adoption of generative AI tools reached 16.3% of the world's population, up from 15.1% in the first half of the year—a key trend shaping the digital landscape. The AI Search Engine Market was valued at approximately $18.84 billion in 2025 and is projected to exceed $50 billion by 2033, while the overall AI market is expected to reach a staggering $1,339 billion by 2030. AI is projected to contribute a 21% net increase to US GDP by 2030 and is expected to see an annual growth rate of 36.6% from 2023 to 2030, underscoring the future impact of this technology on society and the economy. These trends are not only transforming business and technology, but are also reshaping society and everyday life, as AI-powered search and voice assistants become increasingly integrated into daily routines. The question for B2B marketing teams in 2026 is not whether buyers are using AI search, it is whether your brand is being cited when they do. Gartner predicted traditional search engine volume would drop 25% by 2026 due to AI chatbots and virtual agents (Gartner, February 2024), and Adobe data shows AI-driven referral traffic to US retail sites surged 693% year over year during the 2025 holiday season (Adobe Digital Insights, January 2026). We aggregated data from OpenAI, Adobe Digital Insights, Gartner, 6sense, Similarweb, Conductor, SE Ranking, Ahrefs, SparkToro, and a dozen other primary and Tier 2 sources to compile the most comprehensive AI search statistics for 2026.
Key Takeaways
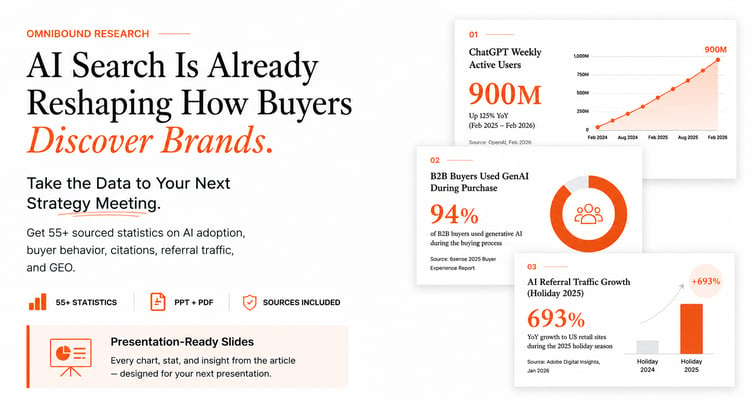
- ChatGPT has reached 900 million weekly active users as of February 2026, up from 400 million in February 2025 (OpenAI, February 2026)
- Gartner predicts traditional search engine volume will drop 25% by 2026 due to AI chatbots (Gartner, February 2024)
- AI referral traffic to US retail sites grew 693% year over year during the 2025 holiday season (Adobe Digital Insights, January 2026)
- AI referrals converted 31% better than non-AI traffic during the 2025 holiday season (Adobe Digital Insights, January 2026)
- 94% of B2B buyers used generative AI tools during their purchase process (6sense, 2025 Buyer Experience Report)
- Zero-click searches reached record levels in 2025, with 58.5% of U.S. searches and 59.7% of EU searches ending without any click to an external website, and an average zero-click rate of 83% when AI Overviews appeared.
- AI Overviews have caused a significant decline in traffic for many businesses, with some reporting decreases of 20-40% since their introduction.
- 60% of all Google searches now end without a click to any website (Bain & Company, cited by Superlines, 2025)
- AI Overviews now appear in 25.11% of Google searches, up from 13.14% in March 2025 (Conductor, 2026 Benchmarks)
- AI Overviews reduce clicks to websites below them by 34.5% (Ahrefs, 2025)
- 44.2% of all LLM citations come from the first 30% of a piece of content — the introduction (SparkToro, January 2026)
- Visitors from AI search tools spend 68% more time on-site than those from traditional organic search (SE Ranking, 2025)
- Only 23% of marketers currently invest in GEO measurement (Incremys, 2025)
- 54% of US marketers plan to implement GEO within 3–6 months (eMarketer, January 2026)
AI Search Platform Adoption and Market Scale
The scale of AI search adoption in 2026 is no longer a forward-looking metric — it is a current operational reality, marked by rapid growth and significant progress in AI adoption worldwide. Notably, AI adoption rates are highest in India at 59%, followed closely by the United Arab Emirates at 58%, with Singapore at 53% and China at 50%. ChatGPT processed 2.5 billion queries per day by July 2025, Perplexity handled 780 million queries in May 2025 alone, and Gemini grew 157% between April and September 2025. The combined query volume across AI platforms now represents a structural category of search that did not exist four years ago, concentrated precisely on the research, learning, and commercial investigation queries that historically drove organic traffic to B2B content sites. Despite this progress, the AI adoption rate reveals a widening divide: adoption in the Global North grew nearly twice as fast as in the Global South, with 24.7% of the working age population in the Global North using AI tools compared to only 14.1% in the Global South.

Platform growth has been fueled by advanced AI models and increased access to AI tools, with global adoption of generative AI tools reaching 16.3% of the world's population in 2025, up from 15.1% in the first half of the year. AI research continues to influence platform development and AI usage trends, shaping how these technologies are integrated and utilized across regions and industries.
|
Metric |
Value |
Source |
|---|---|---|
|
ChatGPT weekly active users (February 2026) |
900 million |
|
|
ChatGPT daily query volume (July 2025) |
2.5 billion queries/day |
|
|
ChatGPT monthly website visits (February 2026) |
5.35 billion |
|
|
Perplexity monthly query volume (May 2025) |
780 million queries |
|
|
Perplexity monthly active users (H2 2025) |
45 million |
|
|
Gemini growth rate (April–September 2025) |
157% growth, reaching 1.1 billion monthly visits |
|
|
AI platform visits growth (January 2025 – January 2026) |
+28.6% (US, desktop + mobile) |
|
|
ChatGPT share of generative AI web traffic (September 2025) |
~79% |
|
|
Total AI chatbot traffic growth YoY (2025) |
81% growth, reaching 55.2 billion visits |
Similarweb’s data shows AI platform visits grew 28.6% while referrals to external sites remained flat over the same period. More users, same outbound click volume — AI platforms are retaining attention rather than distributing it. Winning a citation is therefore both harder and more valuable than it was 18 months ago.
Source: Similarweb Generative AI Statistics Report, March 2026
Zero-Click Search and the Declining Value of Traditional Rankings
The fundamental contract between brands and search engines — rank well, get traffic — is dissolving. Organic click through rates (organic CTR) collapsed in 2025, with brands seeing a 61% drop when AI Overviews appeared on their target queries. Zero-click search is not a new phenomenon, but it has crossed a threshold in 2025 and 2026 where it can no longer be treated as a fringe behavior. Zero clicks reached record levels in 2025, with 58.5% of U.S. searches and 59.7% of EU searches ending without any click to an external website. When 93% of AI Mode search sessions end without a website visit, and 60% of all Google searches end without a click, the implication for content strategy is structural: visibility in AI-generated answers is no longer a supplemental channel, it is the primary discovery mechanism for a large and growing share of buyer research. AI Overviews have caused a significant decline in search traffic and website traffic for many businesses, especially those relying on traditional rankings.
|
Metric |
Value |
Source |
|---|---|---|
|
Google searches ending without a click (US) |
58.5% |
|
|
Google searches ending without a click (Europe) |
59.7% |
|
|
Mobile searches ending without a click |
75% |
|
|
Zero-click rate in Google AI Mode |
93% |
|
|
Zero-click rate in Google Search with AI Overview |
43% |
|
|
Zero-click rate in Google Search without AI Overview |
34% |
|
|
Gartner prediction: drop in traditional search engine volume by 2026 |
25% |
|
|
AI Overviews: reduction in clicks to websites below them |
34.5% |
|
|
CTR drop for top-ranking page when AI Overview is present |
58% lower average CTR |
The Gartner 25% prediction (made in February 2024) has attracted scrutiny. Data from Datos and SparkToro shows the predicted drop is proceeding unevenly — concentrated on informational queries rather than across all query types. The directional trend is confirmed; the magnitude varies by vertical and query category. B2B SaaS and research-heavy queries are among the most affected.
Brands cited in AI Overviews earn 35% more organic clicks and 91% more paid clicks compared to non-cited competitors on the same queries, highlighting the importance of being included in AI-generated responses. Branded searches and transactional keywords remain more resilient, helping maintain click through rates even as organic CTR and website traffic decline.
Source: Gartner Press Release, February 2024
B2B teams that want to understand exactly which buyer prompts are triggering AI answers in their category — and where competitors are being cited instead — can use Omnibound’s AI Search to track prompt-level citation gaps in real time.
AI Referral Traffic Quality and Conversion Performance
AI-referred traffic is not just growing in volume — it is measurably higher quality than traditional organic traffic on every engagement dimension Adobe tracks. While AI search accounts for less than 1% of total web traffic currently, its search traffic visitors convert 23 times better than traditional search traffic. In 2025, AI-powered search tools captured between 12-15% of global search market share, up from roughly 5-6% at the start of the year, and AI referral traffic has grown significantly as a result. During the 2025 holiday season, AI referrals converted 31% better than non-AI traffic, with revenue per visit up 254% year over year. The mechanism is well understood: AI search users arrive with higher intent, having already synthesized their research options through a conversational interface before clicking through. AI-generated responses often draw from different sources—such as Wikipedia, Reddit, YouTube, and major news outlets—which can impact the quality and diversity of referral traffic. For B2B marketers, the implication is that being cited in AI-generated answers reaches buyers at the highest-intent moment in their research cycle.

|
Metric |
Value |
Source |
|---|---|---|
|
AI referral traffic to US retail sites (2025 holiday season YoY growth) |
693% |
|
|
AI referral traffic to US retail sites (Q1 2026 YoY growth) |
393% |
|
|
AI referrals vs. non-AI conversion rate (holiday season 2025) |
31% higher conversion |
|
|
AI-driven revenue per visit growth (holiday season 2025) |
Up 254% YoY |
|
|
Time on-site for AI-referred visitors vs. non-AI (holiday 2025) |
45% longer |
|
|
Bounce rate for AI-referred traffic vs. non-AI |
33% lower |
|
|
Average time on-site for AI platform visitors vs. traditional search |
68% longer |
|
|
LLM sessions from ChatGPT to websites (January–May 2024 vs. same period 2025) |
17,000 → 107,000 sessions |
Adobe’s data covers over 1 trillion visits to US retail sites, making it the largest and most methodologically robust dataset on AI referral traffic quality available. The B2B conversion picture has fewer primary data points at this scale; the retail and ecommerce figures are the best available proxy for intent quality across AI-referred sessions.
Source: Adobe Digital Insights, AI Traffic Surges Across Industries, January 2026
Google AI Overviews and AI Mode: Citation Patterns and Content Performance
Google remains the dominant search surface, and AI Overviews now appear in one in four searches. AI systems like ChatGPT and Copilot generate ai citations from different sources, including authoritative sources such as Wikipedia, Reddit, YouTube, and major news outlets, which increases the importance of content credibility and citation readiness. Understanding how Google decides what to cite is therefore the highest-leverage technical decision in content strategy for 2026. 76.1% of URLs cited in Google AI Overviews also rank in the top 10 of traditional search results — but 59.6% of AI Overview citations come from URLs not ranking in the top 20. These two facts coexist because AI Mode draws from a wider source pool than traditional organic rankings, rewarding content depth, structured formatting, and off-site citation presence over pure ranking position. The structural characteristics of content, such as authority and formatting, directly influence copilot rank and chatgpt citations, making it essential to optimize for ai citations and authoritative sources. Notably, brands cited in AI Overviews earn 35% more organic clicks and 91% more paid clicks compared to non-cited competitors on the same queries, highlighting that optimizing for AI citations is now more important than traditional ranking alone.

|
Metric |
Value |
Source |
|---|---|---|
|
Share of Google searches triggering AI Overviews |
25.11% (up from 13.14% in March 2025) |
|
|
Keywords triggering AI Overviews in US SERPs |
30% |
|
|
AI Overview citations also ranking in Google top 10 |
76.1% |
|
|
AI Overview citations from URLs not in top 20 organic results |
59.6% |
|
|
Average number of links in a Google AI Mode answer |
12.6 |
|
|
Average number of sources cited in AI Overviews |
13.3 |
|
|
Overlap between AI Overviews and AI Mode URLs |
10.7% of URLs; 16% of domains |
|
|
Pages not updated in 3+ months: likelihood of losing citations |
3x more likely to lose citations |
|
|
Share of AI Overview responses triggered by informational queries (January 2025) |
91.3% |
The low overlap between AI Overviews (13.3 sources) and AI Mode (12.6 sources) — just 10.7% of URLs in common — means visibility on one Google surface does not guarantee visibility on the other. Users often do not scroll past the initial portion of an AI Overview, typically reading only about 30% of the content, which impacts citation likelihood and click-through rates. B2B teams optimizing only for traditional rankings are systematically underinvested in the content signals (structured formatting, third-party citation presence, content freshness, and authoritative sources) that drive AI Mode inclusion and increase the chances of being cited by AI systems.
Source: SE Ranking AI Statistics, 2025
Citation Signals: What Drives AI Inclusion and GEO Performance
Being cited in AI-generated answers is not random, and the signals driving inclusion are increasingly well-documented. Recent studies and ongoing AI research have identified critical factors influencing citation likelihood, such as the use of authoritative sources—including established news outlets, credentialed experts, Wikipedia, and YouTube—and the structure of content. The progress made in understanding how different sources, including community platforms and major news outlets, contribute to AI citation rates is critical for optimizing GEO performance. The top five consistent drivers of LLM citations are domain authority, high-quality backlinks from DA 60+ sites, mentions in “best” and “top” listicles, total backlink volume, and unique referring domains (Growth Memo, February 2026). But the content-level signal that surprises most teams: 44.2% of all LLM citations are drawn from the first 30% of content — the introduction — making opening paragraphs the highest-leverage GEO investment on any page.

|
Metric |
Value |
Source |
|---|---|---|
|
Share of LLM citations from the first 30% of content (intro) |
44.2% |
|
|
Share of LLM citations from the middle 30–70% of content |
31.1% |
|
|
Share of LLM citations from the final 30% of content |
24.7% |
|
|
Web mentions outperforming backlinks for AI Overview presence |
3:1 ratio |
|
|
Pages with sequential headings and rich schema: citation rate advantage |
2.8x higher citation rates |
|
|
Brands earning both mentions and citations: reappearance likelihood advantage |
40% higher likelihood of reappearing across answers |
|
|
AI Overview citations from community platforms (Reddit, YouTube) |
~48% |
|
|
Brand mentions originating from third-party pages vs. owned domains |
85% third-party |
|
|
Content with statistics cited every 150–200 words: AI visibility advantage |
30–40% higher visibility |
|
|
Reddit’s share of Google AI Overview citations (June 2025) |
21% |
The finding that 85% of brand mentions in AI answers originate from third-party pages — not owned domains — is the most strategically significant citation signal in this dataset. It means traditional content marketing (publishing on your own site) is necessary but not sufficient for AI visibility. Off-site presence — G2 reviews, analyst mentions, industry listicles, Reddit threads, press coverage — is a primary GEO lever, not a secondary one.
Source: AirOps, The 2026 State of AI Search
Omnibound’s Intelligent Research surfaces the exact prompts buyers are typing into AI engines — including which third-party sources are being cited in answers for your category — so your content and PR strategy targets the right off-site surfaces.
GEO Adoption, Measurement Gaps, and Market Projections
Marketers recognize the shift. Most are not yet acting on it with structured programs. 54% of US marketers plan to implement GEO within 3–6 months, but only 23% currently invest in measurement (eMarketer, January 2026; Incremys, 2025). Notably, 64% of businesses believe that artificial intelligence will help increase their overall productivity, reflecting growing confidence in AI's potential to transform business operations. The adoption and responsible use of AI technology are increasingly supported by advances in education and formal ai governance frameworks, which help ensure ethical and effective integration across industries. Technology and artificial intelligence are now central to shaping business operations and market projections. Without measurement, optimization is guesswork. The GEO market itself is valued at $848 million in 2025 and projected to reach $33.7 billion by 2034 at a 50.5% CAGR — a trajectory consistent with early-stage channel breakout, where first movers compound advantages that become increasingly difficult for late entrants to close.

|
Metric |
Value |
Source |
|---|---|---|
|
US marketers planning GEO implementation within 3–6 months |
54% |
|
|
Marketers currently investing in GEO measurement |
23% |
|
|
GEO market size (2025) |
$848 million |
|
|
GEO market projected size (2034) |
$33.7 billion |
|
|
GEO market CAGR (2025–2034) |
50.5% |
|
|
AI search advertising spend (2025) |
$1 billion |
|
|
AI search advertising spend projected (2029) |
$26 billion |
|
|
Content optimized for GEO: visibility increase in AI search results |
30–40% |
|
|
Only 30% of brands stay visible from one AI answer to the next |
30% |
|
|
B2B websites that saw meaningful traffic decline from 2024 to 2025 |
73% (average YoY drop: 34%) |
Context note: The measurement gap (54% plan to act vs. 23% currently measuring) is the defining GEO maturity challenge in 2026. GEO ROI is structurally harder to measure than SEO because zero-click AI answers generate no referral sessions, and shortlist influence — the most commercially valuable AI impact — happens before any trackable touchpoint. Teams that build measurement frameworks now will have compounding data advantages over teams that start later.
Source: eMarketer, GEO Adoption Data, January 2026
Omnibound’s Marketing Context Engine centralizes the buyer and market signals that determine which prompts AI engines associate with your category — making structured GEO execution possible without building a separate research infrastructure from scratch.
AI Search by the Numbers: Summary Table
|
Metric |
Value |
Source |
|
ChatGPT weekly active users (February 2026) |
900 million |
|
|
ChatGPT daily query volume |
2.5 billion queries/day |
|
|
Perplexity monthly active users (H2 2025) |
45 million |
|
|
Gemini monthly visit growth (April–September 2025) |
157% |
|
|
AI chatbot traffic growth YoY (2025) |
81%, reaching 55.2 billion visits |
|
|
Traditional search engine volume drop predicted by 2026 |
25% |
|
|
Google searches ending without a click (US) |
58.5% |
|
|
Zero-click rate in Google AI Mode |
93% |
|
|
AI Overviews: share of Google searches |
25.11% |
|
|
AI Overview: CTR reduction for top organic result |
58% lower |
|
|
AI Overviews: click reduction to pages below them |
34.5% |
|
|
B2B buyers using generative AI during purchase process |
94% |
|
|
AI referral traffic to US retail (2025 holiday season YoY) |
693% |
|
|
AI referral conversion vs. non-AI (holiday season 2025) |
31% higher |
|
|
AI-driven revenue per visit growth (holiday season 2025) |
254% YoY |
|
|
Time on-site for AI-referred visitors vs. traditional |
68% longer |
|
|
LLM citations from first 30% of content |
44.2% |
|
|
AI Overview citations from non-top-20 organic pages |
59.6% |
|
|
Brand mentions in AI answers from third-party pages |
85% |
|
|
Pages with rich schema and sequential headings: citation rate advantage |
2.8x higher |
|
|
Pages not updated in 3+ months: citation loss risk |
3x more likely to lose citations |
|
|
US marketers planning GEO implementation within 3–6 months |
54% |
|
|
Marketers currently investing in GEO measurement |
23% |
|
|
GEO market projected size by 2034 |
$33.7 billion |
|
|
GEO market CAGR (2025–2034) |
50.5% |
Methodology and Sources
This article was compiled by aggregating statistics from Tier 1 primary research organizations and Tier 2 reputable data aggregators with disclosed methodology. All statistics were traced to their original source before inclusion. Tier 3 blog-to-blog citations without primary attribution were excluded. Statistics from 2023 or earlier are flagged as "most recent available data" where used.
Primary sources (Tier 1):
OpenAI — Weekly active user announcements, July 2025 and February 2026; daily query volume, July 2025
Gartner — Predicts 2024: Search Engine Volume Will Drop 25% by 2026, February 2024
Adobe Digital Insights — AI Traffic Surges Across Industries, January 2026; AI-Powered Shopping Rises, July 2025; Q2 2025 AI Referral Surge Report; Explosive Rise of Generative AI Referral Traffic, February 2025 (based on 1 trillion+ US retail site visits)
6sense — 2025 Buyer Experience Report, November 2025 (n=4,510 B2B buyers)
Ahrefs — AI Overviews Reduce Clicks Update, 2025–2026; ChatGPT and AI search citation analysis, 2025
SparkToro — LLM Citation Analysis, January 2026
Perplexity AI — CEO Aravind Srinivas, query volume data, May 2025
eMarketer — GEO Adoption Intentions, January 2026
Tier 2 sources (methodology disclosed):
Similarweb — 2026 AI Brand Visibility Index and Generative AI Statistics, March 2026 (US desktop + mobile, cross-platform panel)SE Ranking — AI Statistics and AI Overview Analysis, 2025 (internal dataset + primary research)
Conductor — 2026 AI Overview Benchmarks (21.9 million queries analyzed)
AirOps / Kevin Indig — The 2026 State of AI Search Report (cross-platform brand visibility tracking)
DemandSage — ChatGPT Statistics, March 2026 (Similarweb data, OpenAI reports)
Business of Apps — Perplexity AI Statistics, 2026 (platform reports + Sacra)
Previsible — AI Traffic Report, 2025 (19 GA4 properties tracked)
OneLittleWeb — AI Chatbot Traffic Study, 2025 (24-month traffic study)
Dimension Market Research — GEO Market Size Projections, cited by Superlines
Incremys — GEO Measurement Survey, 2025, cited by NAV43
.png?height=245&name=Content%20Marketing%20Statistics%20(2026).png)
%20Statistics%20(2026)%2055+%20Data%20Points%20on%20Brand%20Visibility%2c%20Buyer%20Discovery%2c%20and%20Citation%20Rates.webp?height=245&name=Answer%20Engine%20Optimization%20(AEO)%20Statistics%20(2026)%2055+%20Data%20Points%20on%20Brand%20Visibility%2c%20Buyer%20Discovery%2c%20and%20Citation%20Rates.webp)
