Understand how often your brand appears in AI-generated answers compared with competing brands. Break performance down by theme, buyer journey stage, location, and AI engine, then investigate the prompts behind the gaps.
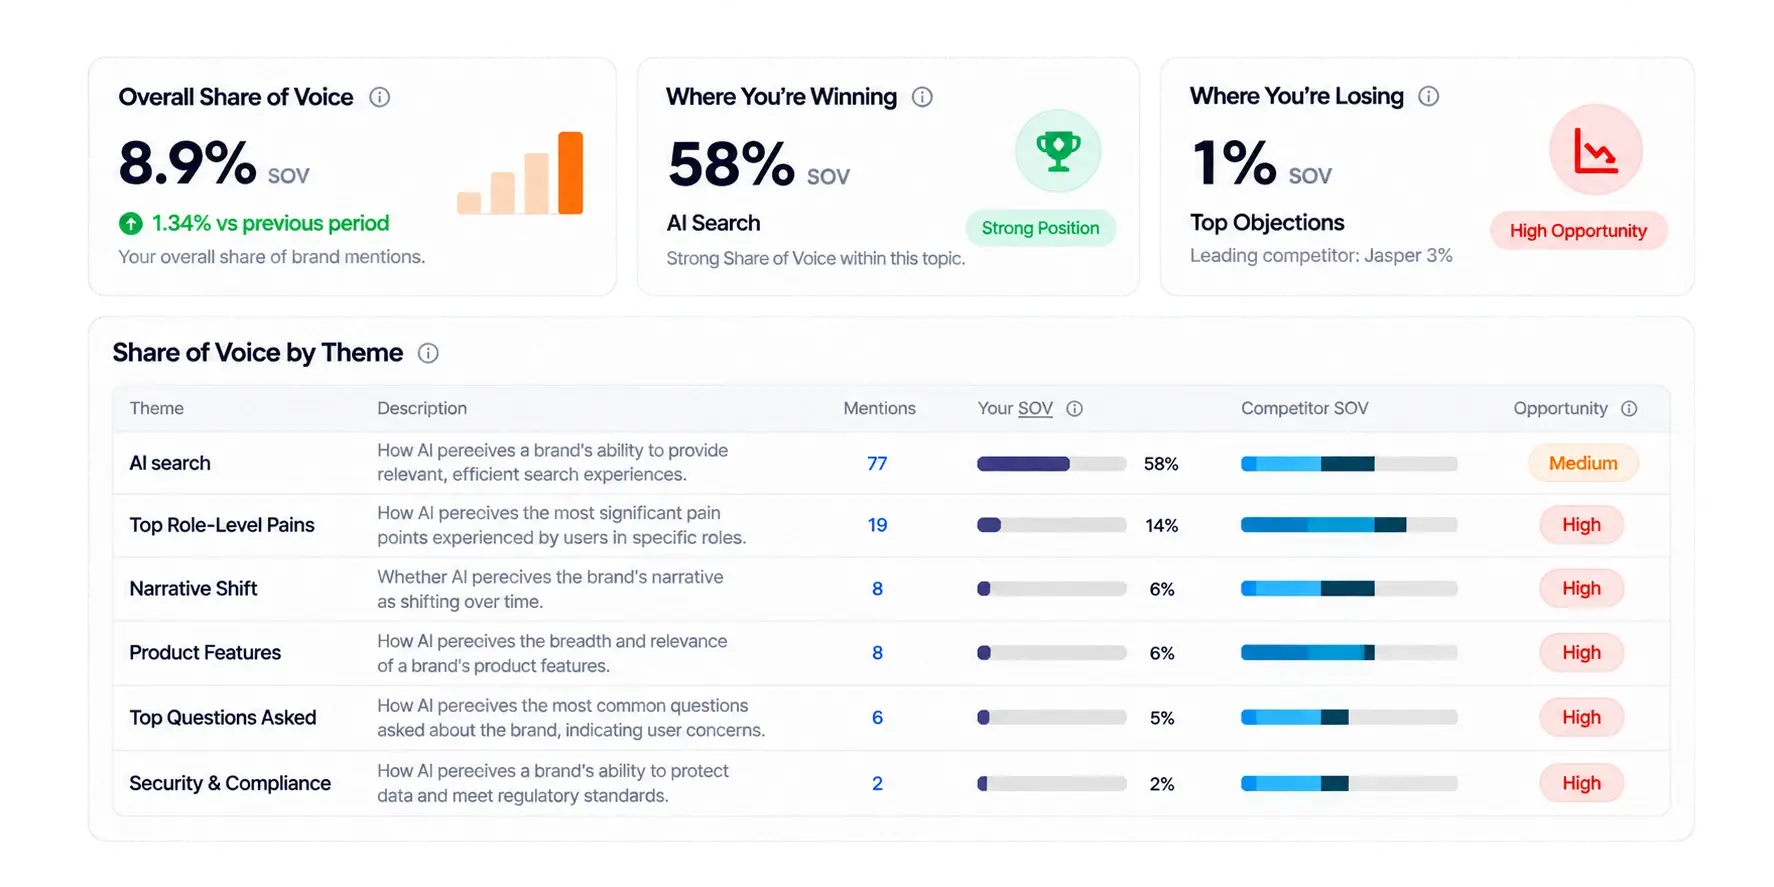
An overall Share of Voice number gives you a starting point. Theme-level and prompt-level analysis helps you understand where that number comes from and what deserves closer attention.
Review overall Share of Voice and period-over-period movement to understand your relative presence across the prompts and brands being tracked. Interpret changes alongside the size and consistency of the comparison set.
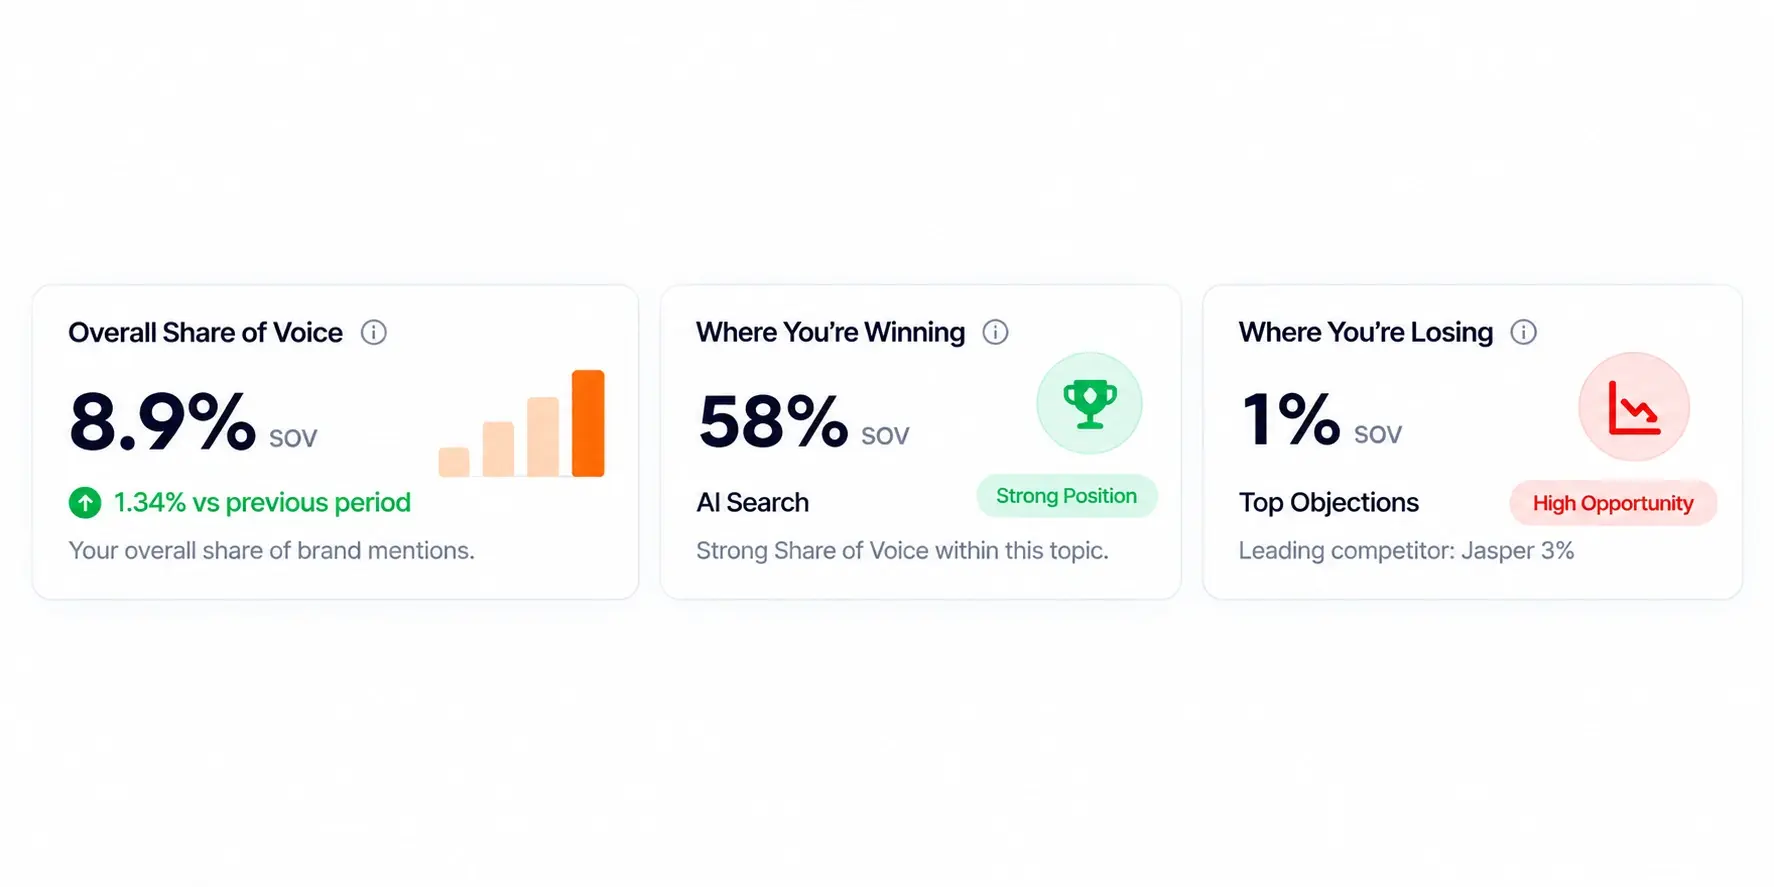
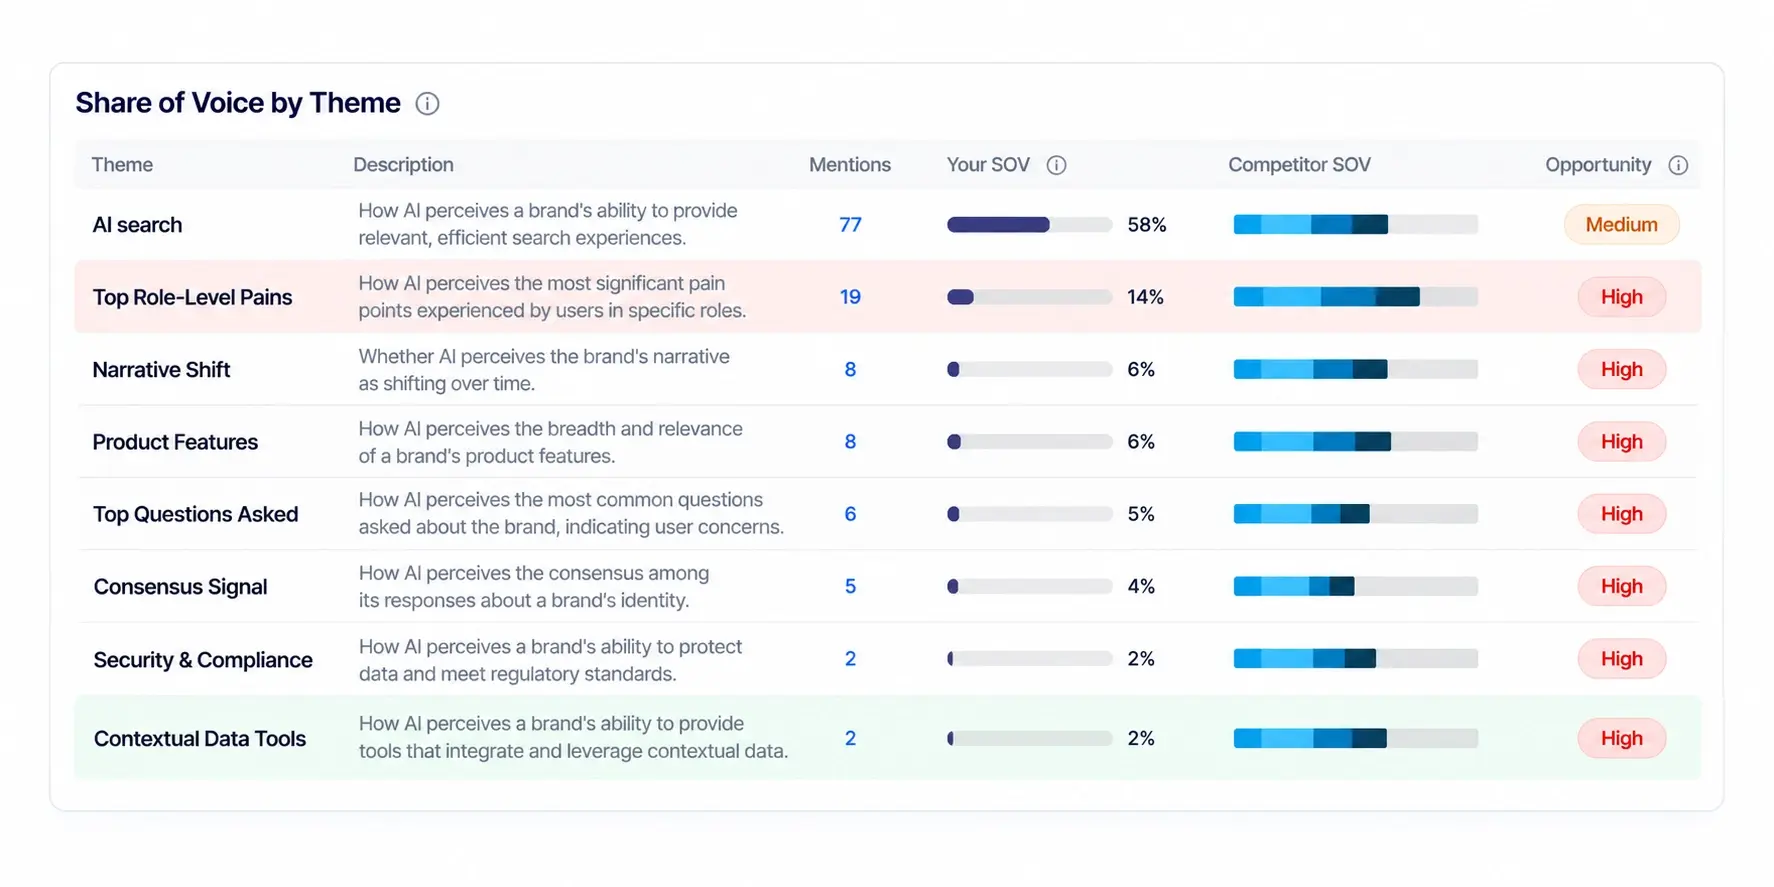
Compare Share of Voice by theme, examine mention counts, and use the opportunity indicator to identify themes that warrant investigation rather than relying on one blended score.
Open a theme to review how competitive Share of Voice varies across buyer journey stages, geographic markets, and AI engines. A strong aggregate result can conceal weaker performance in a specific segment.
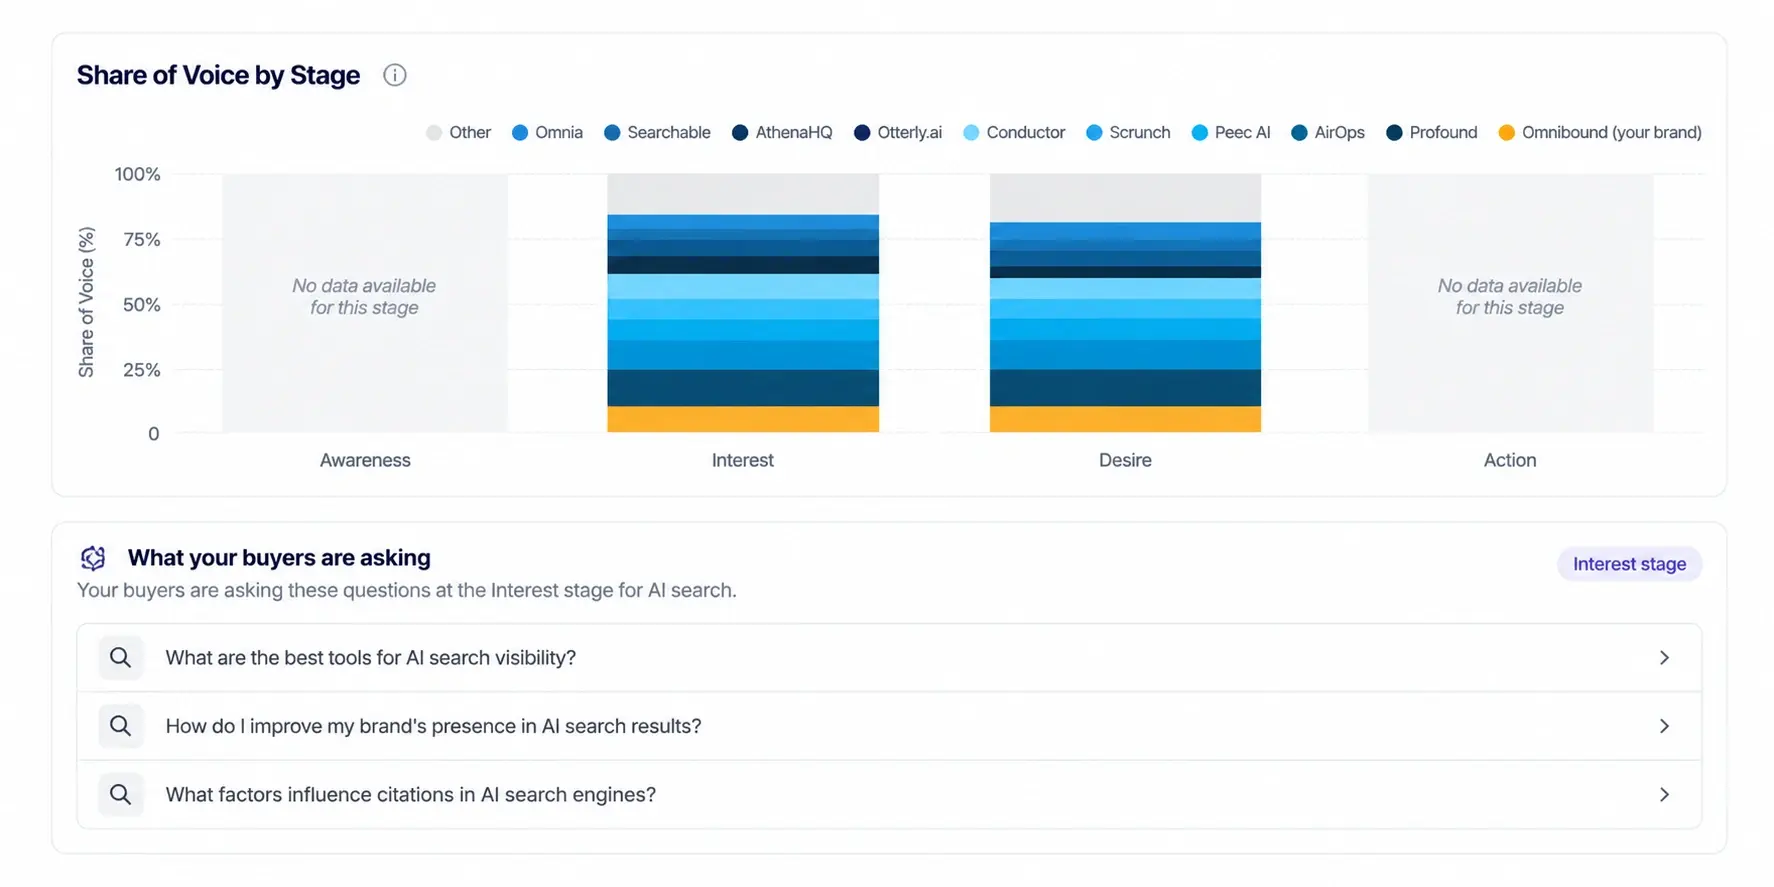
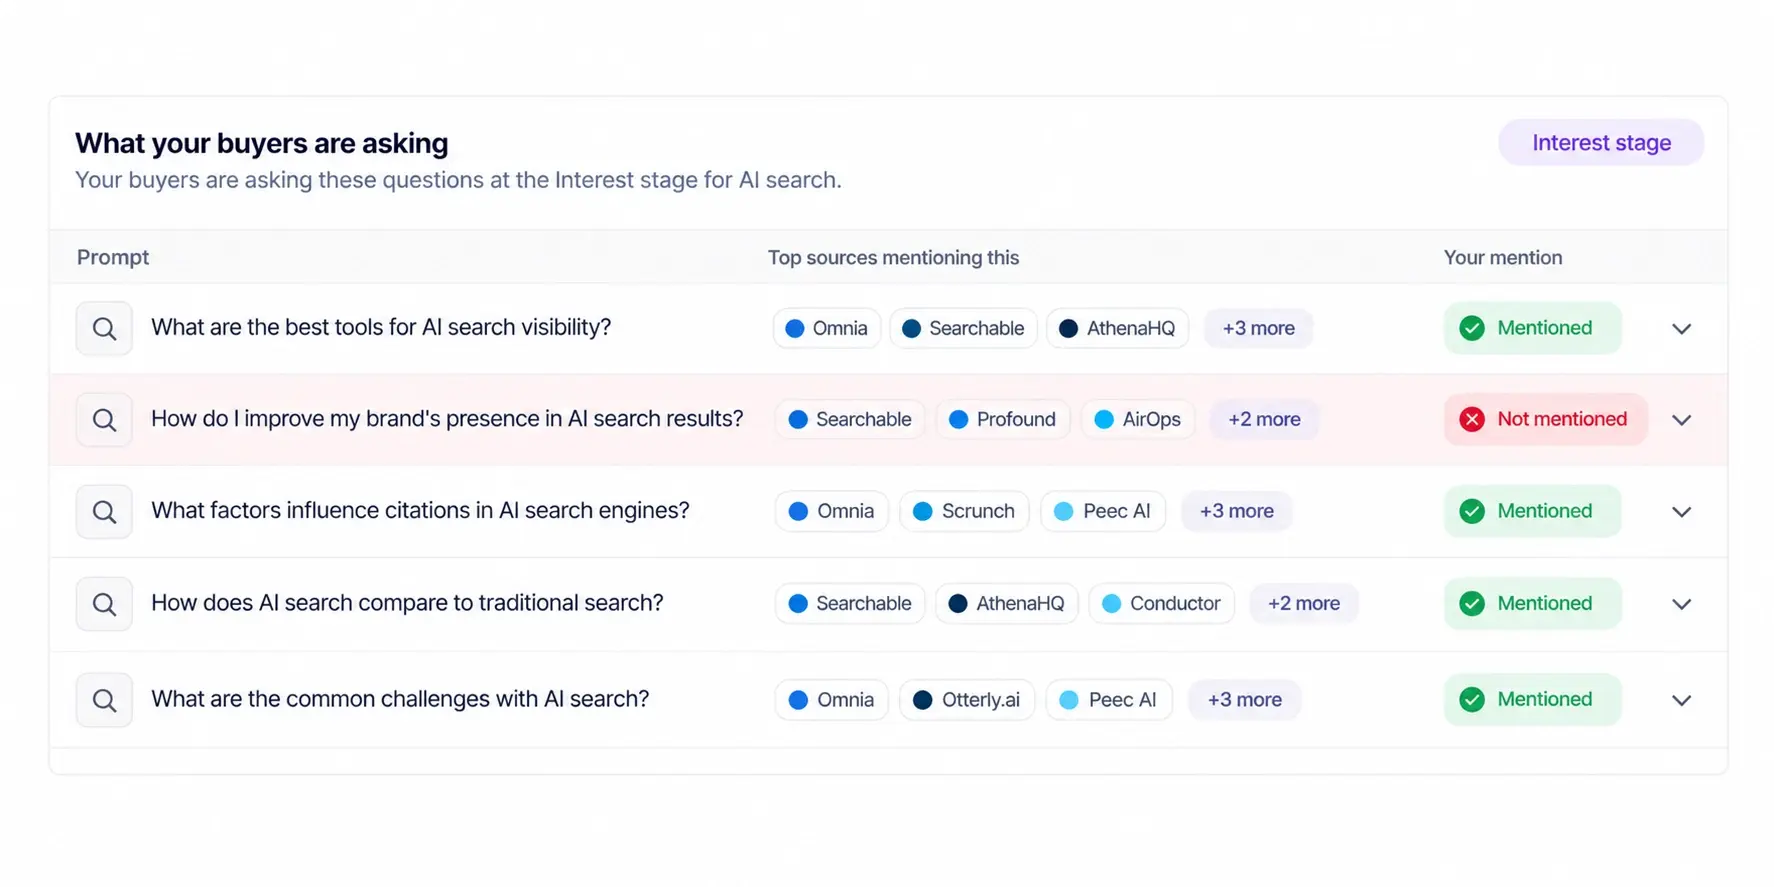
Use the theme’s mention details to reach the prompts associated with the result. Investigate which questions include your brand, which competitors are mentioned, and where further review may be useful.
Use Share of Voice as a diagnosis layer. It points to where performance differs; the related prompt, citation, and content views help your team investigate the reason before choosing an action.
Review the overall score and comparison period. Check whether the prompt set, competitor set, location, or AI engine coverage changed before treating a movement as a genuine gain or loss.
Choose a theme with weak share or a high opportunity indicator, then examine its stage, geography, and engine breakdown. Avoid assuming every low score has the same cause.
Open the associated prompts and review the answers, brand mentions, and competitor appearances. Where citations are available, inspect which sources are referenced before selecting a content or authority action.
Review whether your site has a useful, specific page that answers the question. A missing topic may call for new content; a weak existing page may need better coverage, structure, or evidence.
Compare the page against the information buyers need and the sources appearing in AI answers. Use the evidence to decide whether to refresh, clarify, or expand the page rather than changing copy blindly.
Review the prompts and cited sources associated with the stronger competitors. Distinguish a content coverage gap from a third-party authority or reputation gap before choosing outreach or content actions.
Keep the relevant prompts organised and compare how brand mentions change over time. Use a consistent prompt set and a suitable comparison window to avoid overreacting to individual answer variations.
AI Share of Voice measures a brand’s relative presence in AI-generated answers compared with the other brands included in the analysis. The exact calculation depends on how mentions, tracked prompts, and the comparison set are defined, so reports should make that methodology clear.
Visibility generally measures how often a brand appears across the tracked answers or prompts. Share of Voice compares a brand’s presence with the presence of competing brands. A brand may appear frequently yet hold a smaller share when competitors are mentioned more often.
Start with themes where your brand has low relative presence or where a competitor leads. Drill into the associated prompts, review the answers and available citation sources, then decide whether the gap relates to missing content, a weak existing page, or third-party sources that influence the answers.
An overall number can hide substantial differences between engines or markets. Segmenting the data helps you see whether a competitive gap is broad or concentrated in one area, while keeping in mind that low sample sizes can make individual segments less reliable.
Choose a cadence that matches your prompt volume and decision cycle. Compare consistent time windows and look for a sustained pattern across themes or prompts before reacting to a single change. After a content or outreach intervention, record the change and evaluate the relevant prompts over a comparable period.
No. Share of Voice is a competitive presence metric, not a direct measure of visits, conversions, pipeline, or revenue. To evaluate business impact, analyse relevant referral traffic and conversion data separately and state the limits of any attribution method.
Use competitive Share of Voice to identify the topics and prompts worth investigating, then connect those findings to your content and optimization workflow.