


Table Of Contents
Last updated: June 2026. We review and update this page quarterly as new primary research is published.
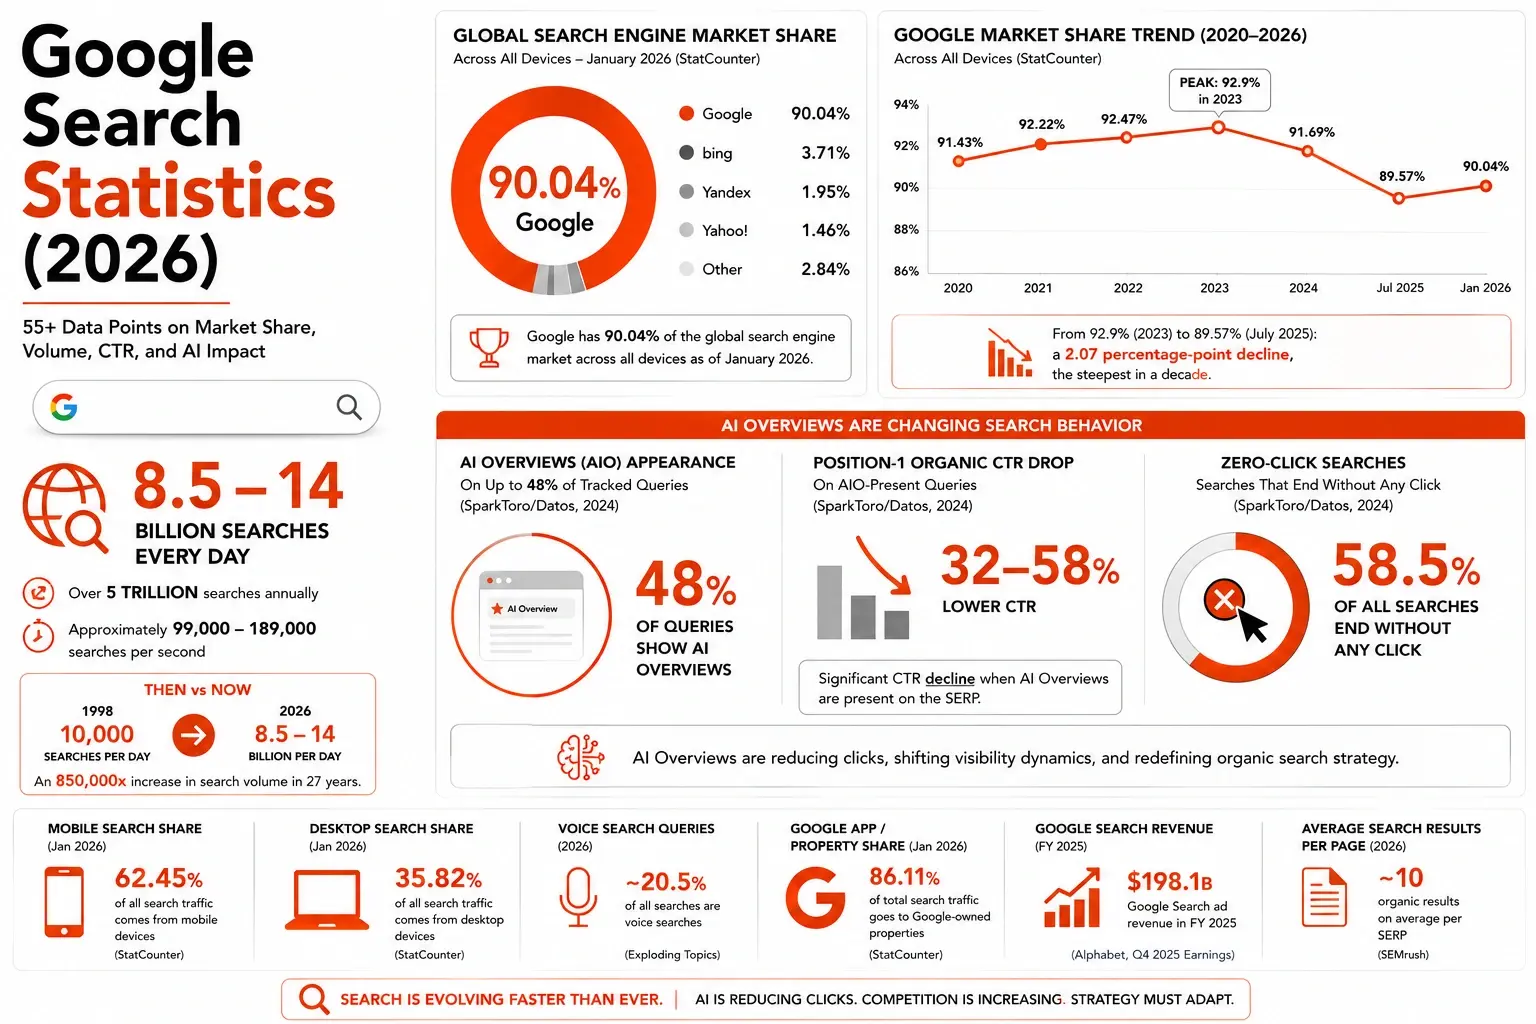
Google processes between 8.5 and 14 billion searches every day — equating to over 5 trillion searches annually and approximately 99,000–189,000 searches per second (Google, official statement; StatCounter via Resourcera, 2025–2026). To contextualize that volume: in the time it takes to read this sentence, Google has processed roughly 600,000 queries. Back in 1998, it processed 10,000 per day. That is an 850,000x volume increase in 27 years.
Google holds 90.04% of the global search engine market across all devices as of January 2026 — but that figure masks the most consequential shift in a decade (StatCounter, January 2026). Google peaked at 92.9% global share in 2023. By July 2025, it had dropped to 89.57% — the lowest point in ten years and a 2.07-percentage-point annual decline, the steepest in a decade. Simultaneously, Google's own SERP behavior is changing faster than its competitive position: AI Overviews now appear on up to 48% of tracked queries, position-1 organic CTR has dropped 32–58% on AIO-present queries, and 58.5% of all searches already end without any click at all (SparkToro/Datos, 2024).
We aggregated data from Alphabet SEC filings, StatCounter, First Page Sage, Backlinko, Ahrefs, SparkToro, BrightLocal, and other primary sources to compile the most rigorously sourced Google search statistics available for 2026.
Key Takeaways
- Google processes 8.5–14 billion searches per day — over 5 trillion annually — with 15% of daily searches never seen before (Google official; StatCounter 2025–2026)
- Google holds 90.04% global search market share (all devices, Jan 2026) — down from 92.9% peak in 2023 (StatCounter, January 2026)
- Mobile accounts for 63%+ of Google's organic search traffic in the US; Google's mobile search share globally is 94.6% (StatCounter, 2026)
- Position 1 on Google earns 39.8% CTR on clean SERPs; drops to under 20% when an AI Overview is present (First Page Sage, May 2025; Ahrefs, December 2025)
- Top 3 organic results receive 68.7% of all clicks on a Google search page (First Page Sage, May 2025)
- Only 0.44% of searchers reach page 2 of Google results (Backlinko research)
- Google Search & Other generated $224.53 billion in revenue in FY2025 — 55.72% of Alphabet's total $402.8B (Alphabet Q4 2025 Earnings Release, SEC EDGAR)
- Google Lens processes 20+ billion visual searches per month — 4x volume vs. 2021 (Google, 2025)
- 58.5% of all Google searches end without any click to an external website (SparkToro/Datos, 2024)
- India has the highest Google search share of any major market at 97.18%; the US trails at 85.05% (StatCounter via Resourcera, January 2026)
- 46% of all Google searches have local intent; 78% of local mobile searches lead to an offline purchase (Google / Coalition Technologies)
- Google Search ad revenue grew 17% YoY in Q4 2025; Alphabet's full-year 2025 revenue exceeded $400 billion for the first time (Alphabet Q4 2025 Earnings, SEC EDGAR)
Google Search Volume and Scale
The sheer scale of Google Search is difficult to internalize. At 8.5–14 billion daily searches, Google is processing more queries each day than there are humans alive. The volume has grown steadily for 27 years, absorbing voice queries, mobile searches, visual searches via Lens, and now AI-mediated searches — each adding new query surfaces rather than replacing existing ones.
The most operationally significant volume statistic is not the total — it's the 15% that are brand new every day. That represents over 1.2–2.1 billion unique queries Google has never seen before in any given 24-hour period. No amount of historical keyword research covers those queries. Content and search strategies built only around known, high-volume keywords structurally miss the long-tail majority.
| Metric | Value | Source |
|---|---|---|
| Daily Google searches | 8.5–14 billion (range across methodologies) | StatCounter / Resourcera 2025–2026; Colorlib 2026 |
| Annual Google searches | 5+ trillion (Google official); 5.9 trillion (estimates) | Google official statement; Resourcera 2025 |
| Searches per second | 99,000–189,815 | Resourcera / SQ Magazine, 2025–2026 |
| Daily searches that are brand new (never seen before) | 15% (1.2B+ per day) | Google, cited by Coalition Technologies |
| Users who search Google 3+ times per day | 77% | Kartik Ahuja, citing Google data, 2025 |
| Daily volume in 1998 (launch year comparison) | 10,000 searches per day | Historical Google data |
| Google Discover monthly active users | 800 million+ | Google official, via AllOutSEO |
| Search interest in "AI" and related queries: YoY growth | +240% | Google Trends analysis, 2025 |
The note on daily search volume is important: figures ranging from 8.5 billion to 16.4 billion are all cited by reputable secondary sources, but none are officially confirmed by Google. The true figure is somewhere in this range and has grown significantly over the past decade. Google's own public statement — "over 5 trillion searches annually" — implies a daily average of roughly 13.7 billion. All volume figures in this article are estimates based on available data and analyst modeling.
Google Search Market Share: Global and by Country
Google's dominance of global search is simultaneously robust and showing its first sustained erosion in a decade. The 90.04% all-device global share (StatCounter, January 2026) is still an extraordinary concentration — every competitor combined controls less than 10% of the market. But the direction of change has shifted. Google peaked at 92.9% in 2023. The July 2025 low of 89.57% represented the largest annual decline (2.07 percentage points) in ten years.
The country-level picture reveals that Google's dominance is not uniform. India and most of Africa represent near-monopoly territory. The US, Japan, Russia, and China each tell different competitive stories — from Bing's growing US foothold to Yandex's Russia dominance and Baidu's near-total control of China.
| Market | Google Search Share | Notes | Source |
|---|---|---|---|
| Global (all devices, Jan 2026) | 90.04% | Down from 92.9% peak (2023) | StatCounter, Jan 2026 |
| Global (mobile only) | 94.6% | Highest mobile concentration ever | StatCounter, 2026 |
| Global (desktop only) | 79.1% | Lowest in 20+ years | Resourcera, Jan 2026 |
| India | 97.18% | Highest of any major market | StatCounter via Resourcera, Jan 2026 |
| United States | 85.05% | Bing holds ~8.16% US desktop | StatCounter via Resourcera, Jan 2026 |
| United Kingdom | ~82.35% (desktop) | Bing holds ~11–13% UK desktop | StatCounter via ElectroIQ, 2024 |
| Germany | ~80.63% (desktop) | Privacy tools have notable share | StatCounter via ElectroIQ, 2024 |
| Japan | ~72% | Bing + Yahoo Japan account for ~23% | Resourcera, 2026 |
| Russia | ~40% (varies) | Yandex leads | StatCounter 2025 |
| China | ~2–4% | Baidu holds ~53% | StatCounter 2025 |
The desktop-mobile split is the most underappreciated data point in this table. Google's desktop search share of 79.1% is the lowest in over 20 years — meaning nearly 1 in 5 desktop searches globally now goes to Bing, DuckDuckGo, or another engine. On mobile, Google retains near-total control at 94.6%. The competitive threat is fundamentally a desktop and enterprise productivity story, not a mobile one — which explains exactly why Microsoft has focused its AI Copilot integration on Windows and edge browser environments.
Google Search CTR by Position
Organic click-through rates by position are among the most studied and most debated statistics in SEO — and 2026 has added a critical new variable: whether an AI Overview is present. CTR benchmarks now split into two distinct regimes: clean SERPs (no AI Overview, no significant features) where position-1 CTR of ~39.8% holds steady, and AI Overview SERPs where position-1 CTR collapses to under 20%.
The First Page Sage meta-analysis (May 2025) — consolidating multiple CTR studies — remains the most cited comprehensive benchmark for 2026. The Ahrefs 300,000-keyword study (December 2025) provides the most rigorous measurement of the AI Overview impact specifically.
| Position | CTR (clean SERP) | CTR (AI Overview present) | Source |
|---|---|---|---|
| Position 1 | 39.8% | ~15–20% | First Page Sage, May 2025; Ahrefs December 2025 |
| Position 2 | 18.7% | ~10% | First Page Sage, May 2025 |
| Position 3 | 10.2% | ~6% | First Page Sage, May 2025 |
| Position 4 | 7.4% | ~4% | First Page Sage, May 2025 |
| Position 5 | 5.1% | ~3% | First Page Sage, May 2025 |
| Positions 6–10 | 1.5–3% each | ~1–2% | First Page Sage, May 2025 |
| Featured snippet CTR | 42.9% | Highest of any element | First Page Sage, May 2025 |
| Top 3 results combined share | 68.7% of all clicks | On clean SERPs | First Page Sage, May 2025 |
| Searchers reaching page 2 | Only 0.44% | Near-zero traffic below page 1 | Backlinko research |
| Position 1: AI Overview CTR reduction | −58% vs. no AIO | Ahrefs study, 300K keywords | Ahrefs, December 2025 |
The featured snippet CTR of 42.9% — higher than organic position 1 — is the most immediately actionable insight in this table. Winning a featured snippet now outperforms ranking at position 1 in terms of click volume. Content structured to directly answer specific questions with clear, concise format (definition → elaboration → supporting data) is the primary mechanism for earning them.
Mobile, Voice, and Visual Search
Mobile is not an emerging channel in Google Search — it has been the majority channel for years and is now deepening its dominance. 63%+ of US organic search traffic comes from mobile devices. Globally, Google's mobile search share is 94.6%. The average mobile page load time is still 8.6 seconds — far above the 3-second threshold at which users abandon — making page speed the most directly controllable variable in mobile search performance.
Voice and visual search are both growing rapidly from smaller bases. Google Lens's jump from 3 billion monthly visual searches in 2021 to 20+ billion in 2025–2026 is a 6x increase in four years. This growth is primarily driven by product discovery and local business exploration — high-intent use cases with direct commercial implications.
| Metric | Value | Source |
|---|---|---|
| Mobile share of US Google organic traffic | 63%+ | Google / Coalition Technologies |
| Google's global mobile search market share | 94.6% | StatCounter, 2026 |
| Mobile share of global web traffic | 63.8% (projected 70% by end 2026) | Thestacc, citing StatCounter 2026 |
| "Near me" search growth since 2015 | +900% (two-year period) | Google, cited by Coalition Technologies |
| Local intent share of all monthly Google searches | 46% (~3.2 billion local searches/day) | Google, cited by Coalition Technologies |
| Local mobile searches leading to offline purchase (within 24 hrs) | 78% | Google BrightLocal, cited by Coalition Technologies |
| Google Lens monthly visual searches | 20+ billion | Google, 2025 |
| Voice searches via Google App | 20%+ of all Google App queries | Coalition Technologies |
| Voice-enabled devices worldwide | 8.4 billion | Yaguara, 2026 |
The 78% offline purchase rate from local mobile searches is one of the highest-converting pathways in all of digital marketing. A consumer who searches "coffee shop near me" on their phone and finds a result converts to an in-store visit within 24 hours at nearly 4-in-5 rates. Local search is not an SEO niche — it's a physical commerce driver with documented conversion rates that rival even the best paid search campaigns.
Google Search Revenue and Business Performance
Google Search is the single most valuable commercial asset in the technology industry. In FY2025, Google Search & Other generated $224.53 billion in revenue — 55.72% of Alphabet's total $402.8 billion, which exceeded $400 billion for the first time (Alphabet, Q4 2025 Earnings Release). Google Search ad revenue grew 17% year-over-year in Q4 2025 alone — demonstrating that, despite AI-driven zero-click growth and market share erosion, the commercial engine is accelerating, not decelerating.
The mechanism is straightforward: AI Overviews have reduced click-through rates to organic results but increased user satisfaction and session time on Google, maintaining or growing query volume. Google's monetization of AI Overview placements, which began in Q3 2025, adds a new revenue surface that doesn't depend on users clicking through to external sites at all.
| Metric | Value | Source |
|---|---|---|
| Google Search & Other revenue (FY2025) | $224.53 billion | Alphabet Q4 2025 Earnings Release, SEC EDGAR |
| Google Search as share of Alphabet total revenue | 55.72% | Alphabet Q4 2025 Earnings Release, SEC EDGAR |
| Alphabet total revenue (FY2025) | $402.8 billion (first time exceeding $400B) | Alphabet Q4 2025 Earnings Release, SEC EDGAR |
| Alphabet net income (FY2025) | $132.2 billion | Alphabet Q4 2025 Earnings Release, SEC EDGAR |
| Google Search ad revenue growth (Q4 2025 YoY) | +17% | Alphabet Q4 2025 Earnings; Search Engine Roundtable |
| Alphabet Q1 2025 total revenue | $90.2 billion (+12% YoY) | Alphabet Q1 2025 Form 8-K, SEC EDGAR |
| Alphabet Q3 2025 total revenue | $102.3 billion (+16% YoY) | Alphabet Q3 2025 Earnings Release, SEC EDGAR |
| Businesses' average return on Google Ads spend | $8 per $1 | AllOutSEO / Google Economic Impact Report |
The Alphabet Q4 2025 earnings data is the hardest primary source in this article — filed directly with the SEC, audited, and publicly disclosed. $224.53 billion in annual Google Search revenue is not an estimate or a projection. It is reported financial performance. At that scale, Google Search generates more revenue annually than most Fortune 100 companies' total revenue.
AI's Impact on Google Search
2025–2026 marks the most consequential structural transition in Google Search since the introduction of PageRank. AI Overviews, launched broadly in May 2024, now trigger on approximately 48% of tracked queries. The effects compound across every organic search metric: zero-click rates have risen from 56% to 69% since launch (Similarweb, 2025), position-1 CTR has dropped 32–58% on AI Overview queries, and Google's own market share has fallen to its lowest point in a decade.
The competitive dynamic adds a new dimension. ChatGPT now handles an estimated 17% of total digital queries globally (First Page Sage, Q4 2025 analysis). Perplexity has captured approximately 1.1% of global search queries. These platforms don't appear in StatCounter's traditional market share data — they operate in a different query category — but they are absorbing queries that would previously have gone to Google, particularly for research and comparison tasks.
| Metric | Value | Source |
|---|---|---|
| AI Overviews: share of all tracked queries (Feb 2026) | ~48% (up 58% YoY from 30%) | BrightEdge, February 2026 |
| Google market share decline (peak to Jul 2025) | 92.9% → 89.57% (−3.33 pp) | StatCounter via Sociallyin, 2025 |
| Steepest annual Google share decline in a decade | −2.07 pp (2024 to 2025) | StatCounter, via Resourcera |
| Zero-click rate: all Google searches (2024) | 58.5% | SparkToro/Datos, 2024 Zero-Click Study |
| Zero-click rate increase since AI Overviews launched | 56% → 69% (+13 pp, May 2024–May 2025) | Similarweb, 2025 |
| Position 1 CTR drop when AI Overview present | −58% | Ahrefs, December 2025, 300K keywords |
| ChatGPT share of total digital queries globally | ~17% | First Page Sage, Q4 2025 analysis |
| Bing market share gain (2024 to 2025) | +1.10 pp (3.51% → 4.61%) | Sociallyin, StatCounter data analysis, 2025 |
The 17% ChatGPT digital query share is the most commercially significant competitive statistic for Google since Bing's launch. It's important to note this is not a Google search market share figure — it's a share of all search-like digital queries, including those that never would have used a search engine at all. But the directional signal is clear: AI-native interfaces are absorbing meaningful query volume, primarily in research and comparison tasks, and that absorption is accelerating.
Google Search by the Numbers
| Metric | Value | Source |
|---|---|---|
| Daily Google searches | 8.5–14 billion | StatCounter / Google 2025–2026 |
| Annual Google searches | 5+ trillion (official); 5.9T (estimated) | Google; Resourcera 2025 |
| Searches per second | 99,000–189,815 | SQ Magazine / Resourcera 2025–2026 |
| New queries per day (never seen before) | 15% of daily volume | Google via Coalition Technologies |
| Users searching Google 3+ times daily | 77% | Kartik Ahuja 2025 |
| Google Discover monthly active users | 800M+ | Google official |
| Global search market share (Jan 2026) | 90.04% | StatCounter Jan 2026 |
| Mobile search market share | 94.6% | StatCounter 2026 |
| Desktop search market share | 79.1% (lowest in 20+ years) | Resourcera Jan 2026 |
| India Google share | 97.18% | StatCounter via Resourcera |
| US Google share | 85.05% | StatCounter via Resourcera |
| UK Google share (desktop) | ~82.35% | StatCounter via ElectroIQ 2024 |
| Germany Google share (desktop) | ~80.63% | StatCounter via ElectroIQ 2024 |
| Japan Google share | ~72% | Resourcera 2026 |
| Position 1 CTR (clean SERP) | 39.8% | First Page Sage May 2025 |
| Position 1 CTR (AI Overview present) | ~15–20% | Ahrefs Dec 2025 |
| Position 1 CTR reduction from AI Overview | −58% | Ahrefs Dec 2025, 300K keywords |
| Featured snippet CTR | 42.9% | First Page Sage May 2025 |
| Top 3 results: share of all clicks | 68.7% | First Page Sage May 2025 |
| Searchers reaching page 2 | 0.44% | Backlinko |
| Mobile share of US organic Google traffic | 63%+ | Google / Coalition Technologies |
| Local intent: share of all Google searches | 46% | |
| Local mobile searches → offline purchase (24 hrs) | 78% | Google / BrightLocal |
| Google Lens monthly visual searches | 20B+ | Google 2025 |
| Voice search: share of Google App queries | 20%+ | Coalition Technologies |
| Google Search & Other revenue (FY2025) | $224.53B | Alphabet Q4 2025 10-K, SEC EDGAR |
| Alphabet total revenue (FY2025) | $402.8B | Alphabet Q4 2025, SEC EDGAR |
| Alphabet net income (FY2025) | $132.2B | Alphabet Q4 2025, SEC EDGAR |
| Search ad revenue growth (Q4 2025 YoY) | +17% | Alphabet Q4 2025; SE Roundtable |
| AI Overviews: share of tracked queries (Feb 2026) | ~48% | BrightEdge Feb 2026 |
| Zero-click rate: all searches (2024) | 58.5% | SparkToro/Datos 2024 |
| Zero-click rate: with AI Overview present | 83% | Bain–Dynata Dec 2024 |
| Google market share decline (2023–Jul 2025) | 92.9% → 89.57% | StatCounter via Sociallyin |
| ChatGPT share of digital queries globally | ~17% | First Page Sage Q4 2025 |
| Bing market share gain (2024–2025) | +1.10 pp | Sociallyin, StatCounter data 2025 |
Methodology and Sources
This article was compiled from official SEC filings, StatCounter platform data, and named primary research. Every statistic was traced to its originating source before inclusion. Secondary aggregators were used only to locate primary sources.
Primary sources (Tier 1):
- Alphabet Inc. — Q4 2025 Earnings Release (filed with SEC, January 2026; all revenue figures Tier 1 financial data); Q3 2025 Earnings Release; Q1 2025 Form 8-K
- StatCounter — Global search engine market share (tracking code on 1.5M+ websites globally, 5B+ monthly pageviews; monthly data 2025–2026). All market share figures in this article trace to StatCounter as primary source.
- Google — Official statements on search volume ("over 5 trillion annually"), Google Lens usage (20B+ monthly), Google Discover (800M+ MAU). Published via Google Blog and Think with Google
- First Page Sage — Google Click-Through Rates by Ranking Position 2026 (meta-analysis of multiple CTR studies including Backlinko, SISTRIX, WordStream; updated May 2025)
- Backlinko — CTR analysis of 4 million search results; position-1 CTR of 27.6% (Backlinko uses different methodology from First Page Sage; both are valid; difference reflects query mix)
- Ahrefs — AI Overviews Reduce Clicks by 34.5% / 58% (April 2025, updated December 2025; 300,000 keywords, Google Search Console aggregate data)
- SparkToro / Datos (Semrush) — 2024 Zero-Click Search Study (Rand Fishkin; clickstream panel of millions of users, September 2022–May 2024)
- BrightEdge — AI Overviews at the One-Year Mark (February 2026; Generative Parser tracking 9 industries)
- BrightLocal — Local Consumer Search Behaviour Report 2024 (consumer search behavior; 66% trust Google most for local)
- Alphametic — Global Search Engine Market Share: Top 15 GDP Nations 2026 (StatCounter data analysis, March 2026)
Notes on data interpretation:
- Google search volume estimates vary significantly (8.5B–16.4B daily) because Google does not publish this figure officially. "Over 5 trillion annually" is Google's own language, implying ~13.7B/day. All volume figures should be treated as estimates, not precise measurements.
- CTR benchmarks from First Page Sage apply to "clean" SERPs with no AI Overviews, local packs, shopping results, or other SERP features. Actual CTRs for any specific query will vary significantly based on SERP composition. The Ahrefs figures represent the AI Overview–present regime specifically.
- StatCounter market share figures are based on page views (not unique visitors), which may overweight frequent visitors and desktop users relative to other methodologies.
Turn Your Content Into AI-Search Winners
Get cited across ChatGPT, Claude & Perplexity — not just ranked on Google.
- Increase AI citations
- Improve answer visibility
- Track brand mentions in LLMs

%2054+%20Data%20Points%20on%20Users%2c%20Enterprise%20Adoption%2c%20Revenue%2c%20and%20Market%20Position.webp?height=245&name=Google%20Gemini%20Statistics%20(2026)%2054+%20Data%20Points%20on%20Users%2c%20Enterprise%20Adoption%2c%20Revenue%2c%20and%20Market%20Position.webp)
%2052%20Data%20Points%20on%20Users%2c%20Usage%2c%20Revenue%2c%20and%20Accuracy.webp?height=245&name=Perplexity%20AI%20Statistics%20(2026)%2052%20Data%20Points%20on%20Users%2c%20Usage%2c%20Revenue%2c%20and%20Accuracy.webp)